PV Capacity Forecast
A full PersistentVolume is one of the quieter outages: writes start failing, a database flips to read-only, and nobody saw it coming. PV Capacity Forecast projects each volume's usage forward, with snapshots at 7 and 30 days, so you can expand or clean up storage before a volume runs out.
Open it under Wave Diagnosis in the sidebar, then PV Capacity. Forecasting needs at least seven days of history; the cluster selector and date-range picker scope the view.
The forecast at a glance
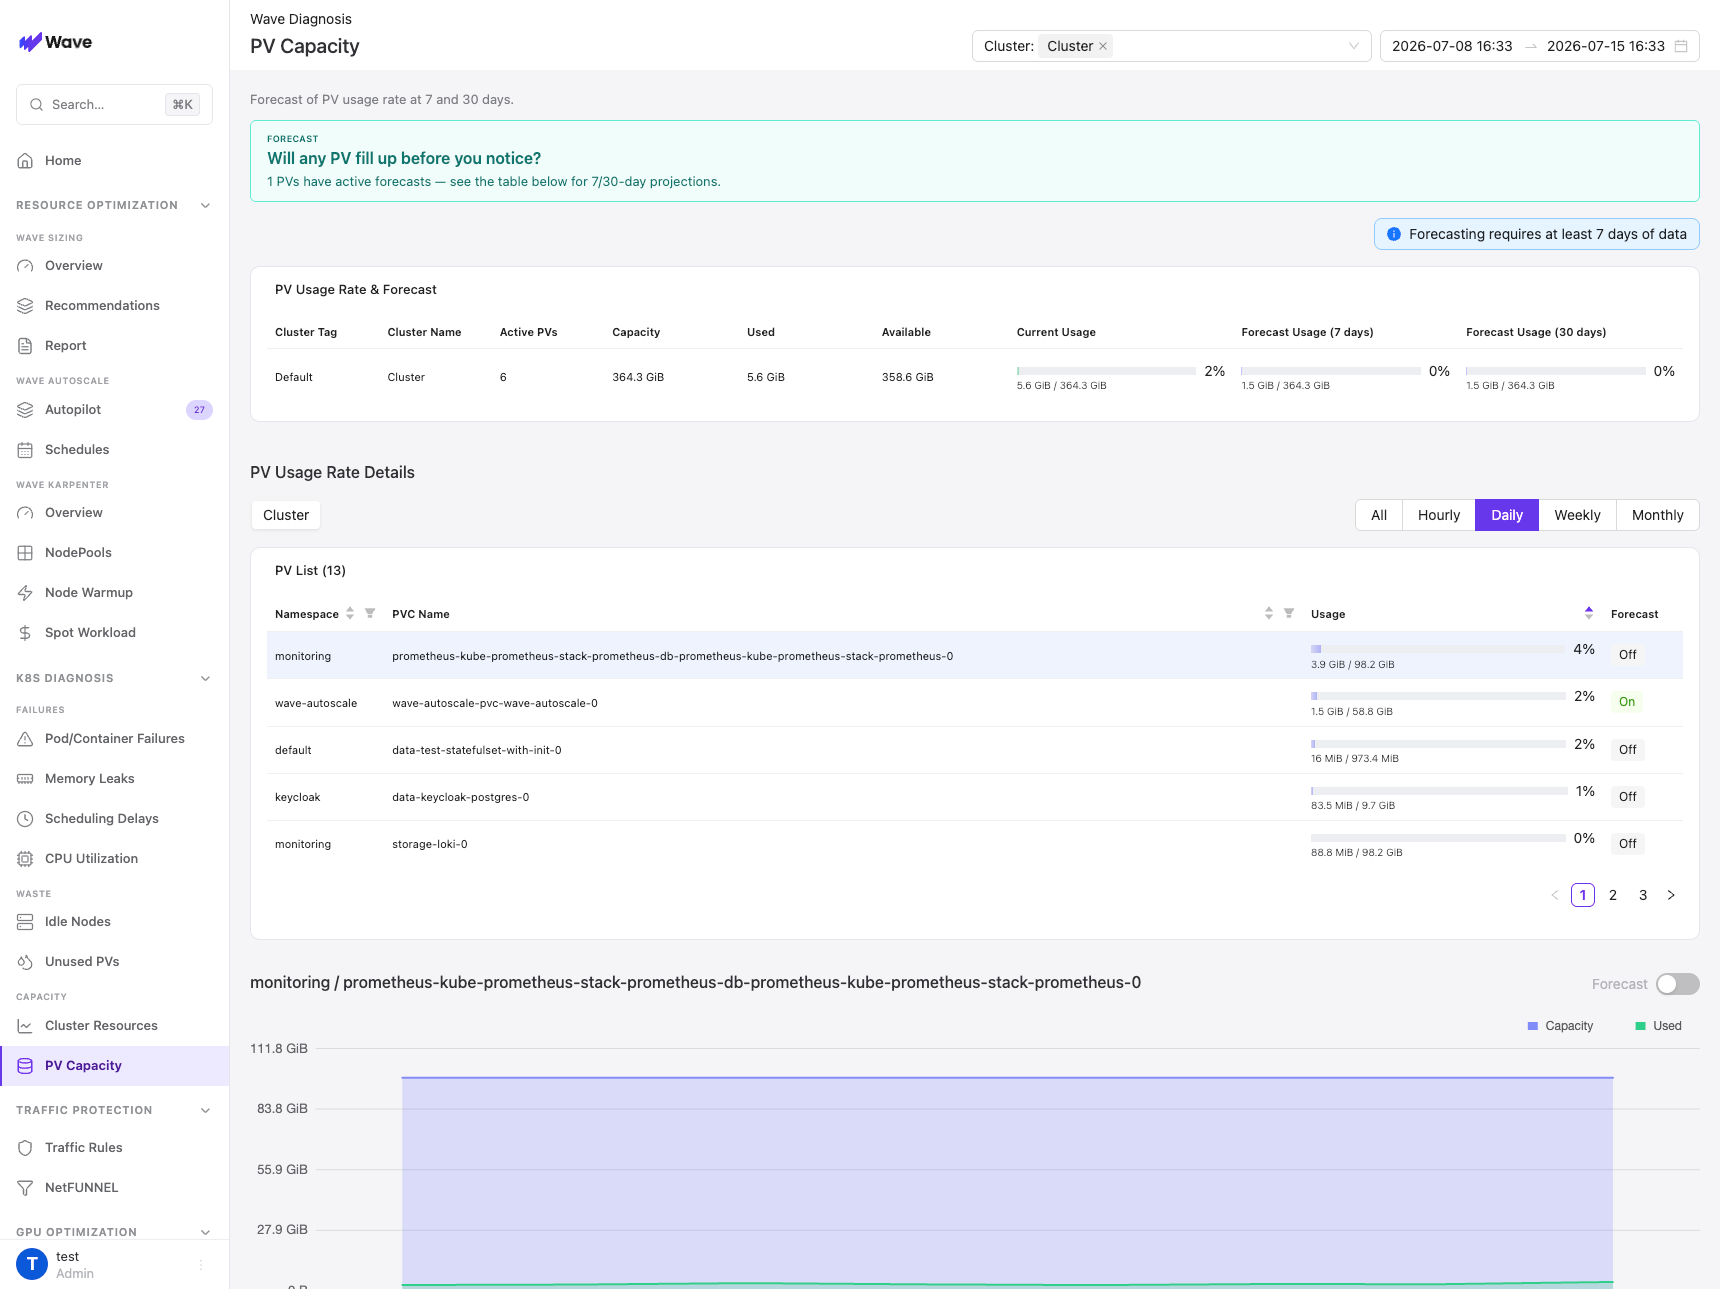
Forecast banner. A one-line answer to "Will any PV fill up before you notice?" It counts how many PVs currently have forecasting turned on and points you to the table for their 7 and 30 day projections.
PV Usage Rate & Forecast table. A per-cluster rollup: Active PVs (volumes being monitored), total Capacity, Used, and Available, the Current Usage bar, and the Forecast Usage (7 days) and Forecast Usage (30 days) bars for the cluster as a whole.
PV list and per-PV forecast
PV Usage Rate Details lists every volume and lets you forecast the ones that matter. Switch the time granularity with All, Hourly, Daily, Weekly, and Monthly.
- PV List shows each volume by Namespace, PVC Name, and a Usage bar (used of capacity, with a percentage), sorted fullest first so the volumes nearing capacity sit on top.
- The Forecast column is a per-PV On / Off toggle. Forecasting is opt-in: flip On for a volume and Wave begins projecting its usage. That is exactly what the banner counts, so you can turn it on only for the volumes you care about rather than every ephemeral claim.
- Select a PV to open its chart: Capacity (the band) against Used (the line) over time, with a Forecast toggle that overlays the projection. Where the projected line climbs toward the capacity band is roughly when that volume runs out.
You read the trend, not a countdown. PV Capacity Forecast shows the projection and the 7 and 30 day snapshots; it does not print a single "days until full" number. Judge the risk from how close the forecast bar is to capacity and how steeply the per-PV line is rising.
Use cases
Prevent database crashes
Databases are the least forgiving of a full disk: writes fail, the database goes read-only, and transactions roll back. Turn forecasting on for your database volumes so you expand them well before the write failures start, rather than recovering from an outage after.
Manage log storage growth
Logs, metrics, and audit trails grow without bound until something clears them. A forecast on your logging and monitoring volumes (Prometheus, Loki, and the like) tells you when steady growth will exhaust the disk, so you can expand, rotate, or archive on your schedule instead of when the pipeline stops.
Support data-intensive workloads
ML training checkpoints, analytics intermediates, and media processing files fill volumes fast and unpredictably. Forecasting the volumes those jobs write to keeps a long-running job from dying halfway through because the disk filled.
What to do when a forecast shows storage risk
When a forecast trends toward capacity, pick the option that fits the workload:
-
Enable PV Auto Expansion for hands-off, zero-downtime growth. Wave expands the volume automatically when usage crosses your threshold, before it fills. See PV Auto Expansion.
-
Expand the PVC manually for a one-time bump. Confirm the storage class allows expansion, then raise the request:
kubectl patch pvc <pvc-name> -p '{"spec":{"resources":{"requests":{"storage":"200Gi"}}}}'This requires a storage class with
allowVolumeExpansion: true; without it you must provision a larger volume and migrate the data. -
Clean up or archive when the volume is full of data it does not need to keep. Add log rotation, move cold data to object storage, and schedule periodic cleanup so the space does not fill straight back up.
Related
- Wave Diagnosis Overview
- Cluster Resource Forecast: the same forecast approach for cluster CPU and memory.
- PV Auto Expansion: grow at-risk volumes automatically before they fill.
- Unused PV Detection: reclaim volumes that are attached but idle.