Getting Started with Alerts
This guide walks you through setting up your first alert, from configuring notification channels to defining alert rules.
Prerequisites
- Wave installed and running in your cluster
- Access to the Wave web console
- Admin permissions to create alerts
- A notification destination (Slack workspace or HTTP endpoint)
Quick Start Overview
Setting up alerts follows a two-step process:
- Create Alert Channels - Define where notifications should be sent
- Create Alert Rules - Define what conditions trigger notifications
Best Practice: Create channels first, then reference them in alert rules. A single channel can be reused by multiple alerts.
Step 1: Access the Alerts Page
Navigate to Alerts
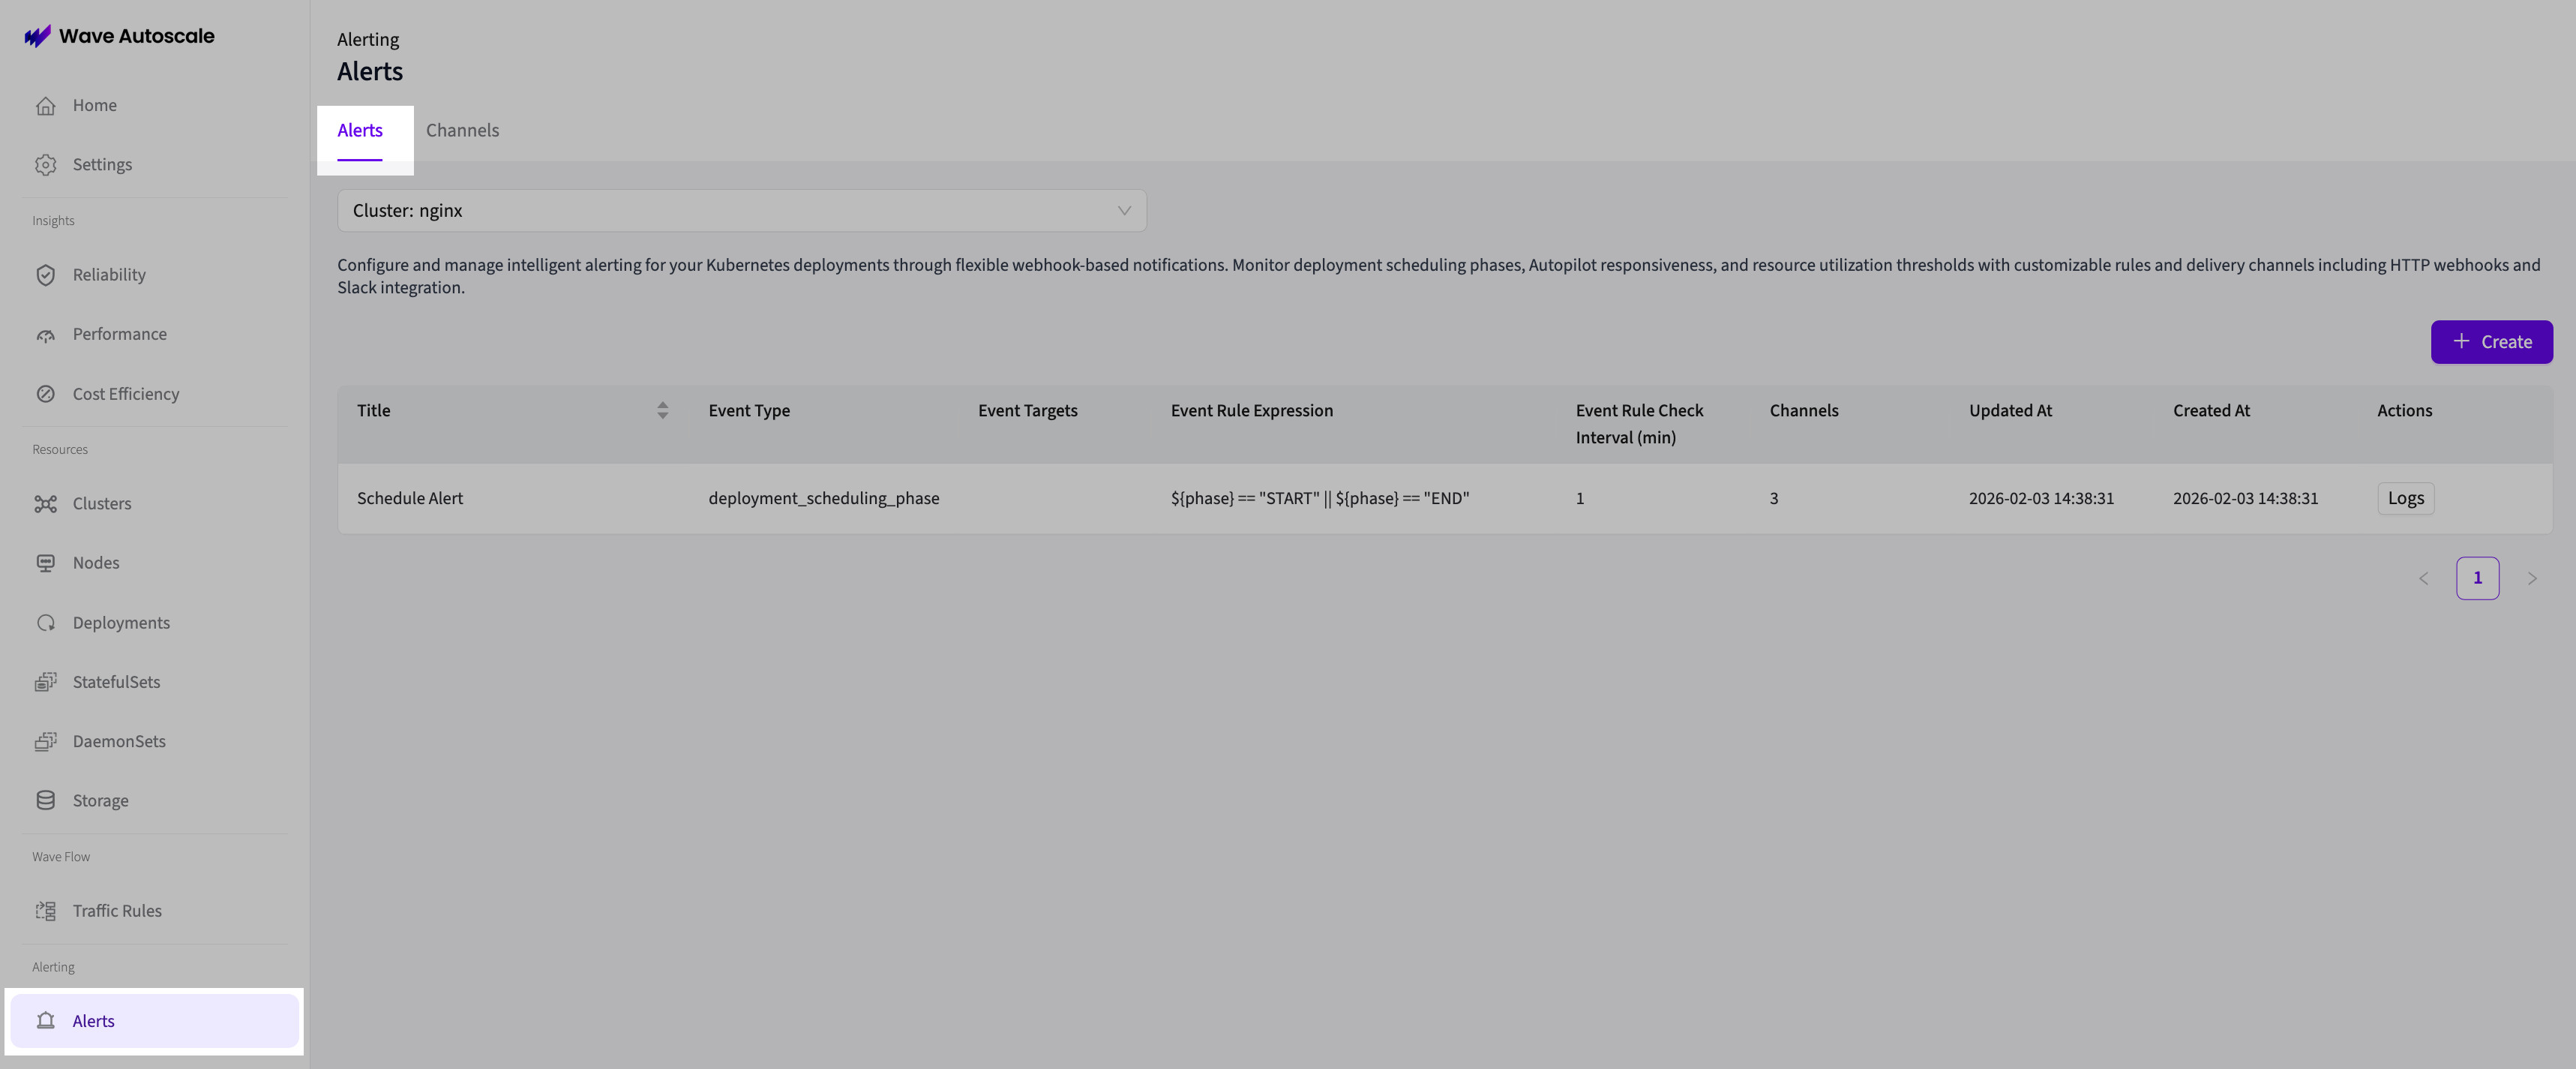
- Select Alerts from the menu
- The Alerts page opens with two tabs:
- Alerts - Manage alert rules
- Channels - Manage notification channels

- Set the right cluster context if using multiple clusters
Step 2: Create an Alert Channel
Alert channels define where notifications are sent. You'll create at least one channel before setting up alert rules.

Choose Channel Type
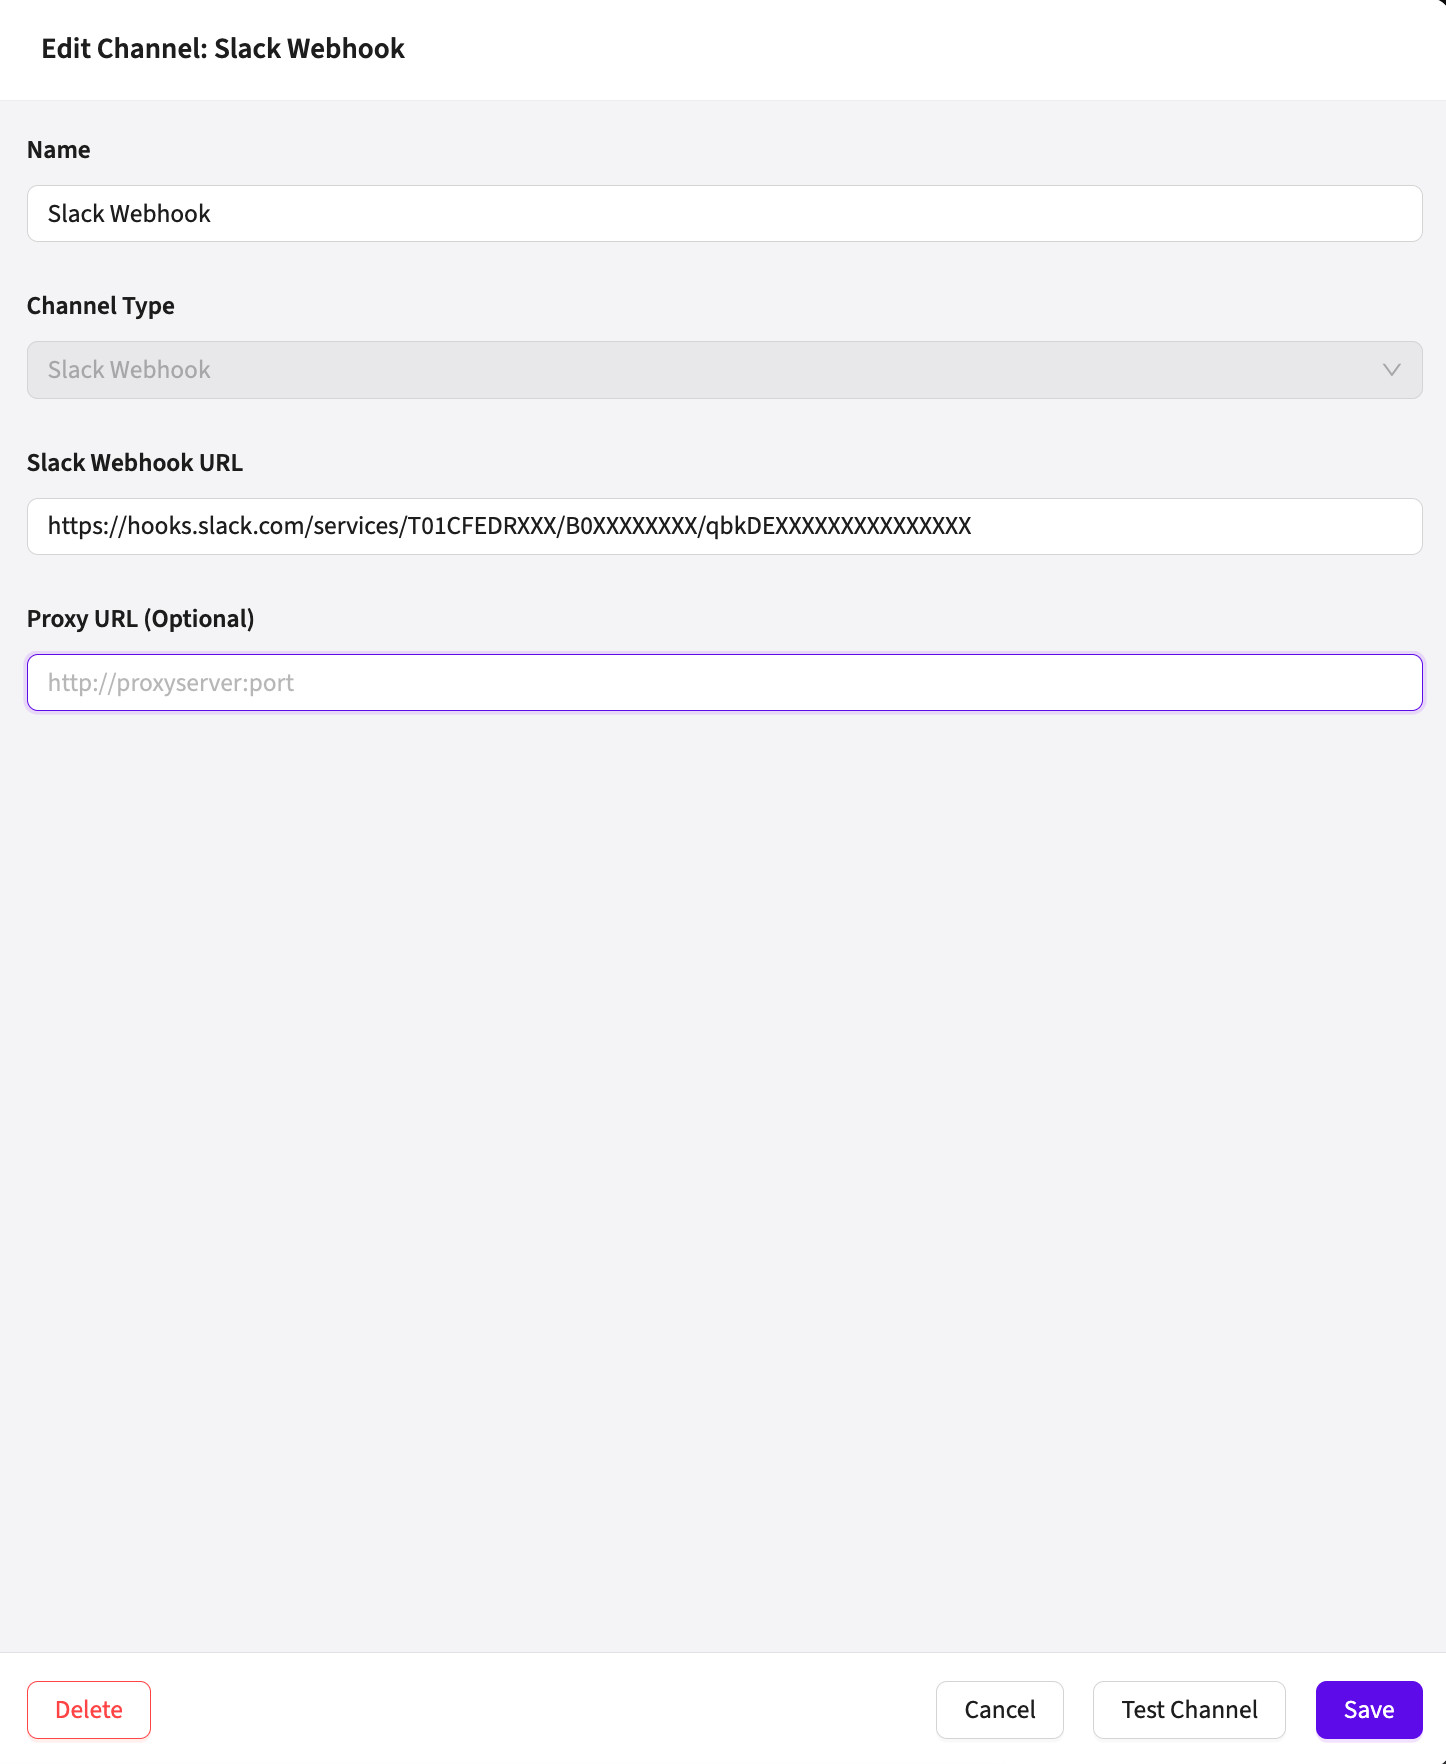
Navigate to the Channels tab and click Create. Choose from three channel types:
HTTP Webhook - For generic webhooks, PagerDuty, custom APIs
- URL: Your webhook endpoint
- Method: POST (default), PUT, PATCH, DELETE
- Headers (optional): Authentication headers like
Authorization: Bearer <token> - Proxy (optional): HTTP proxy URL for enterprise networks
Slack Webhook - Simple Slack integration
- Webhook URL: Slack incoming webhook URL (get from Slack App settings)
- Proxy (optional): HTTP proxy URL
Slack Web API - Advanced Slack features
- Token: Bot token starting with
xoxb- - Channel: Channel ID (e.g.,
C1234567890) or name (e.g.,#alerts) - Proxy (optional): HTTP proxy URL
Configure HTTP Webhook Example
{
  "name": "PagerDuty Production",
  "type": "http",
  "data": {
    "url": "https://events.pagerduty.com/v2/enqueue",
    "method": "POST",
    "headers": {
      "Authorization": "Token token=your-integration-key",
      "Content-Type": "application/json"
    }
  }
}
Configure Slack Webhook Example
{
  "name": "Team Dev Channel",
  "type": "slack_webhook",
  "data": {
    "webhook_url": "https://hooks.slack.com/services/T00000000/B00000000/XXXXXXXXXXXXXXXXXXXX"
  }
}
Test the Channel
Before saving, click Test to verify:
- Network connectivity
- Authentication validity
- Endpoint availability
The test sends a sample notification and displays the response. Fix any errors before proceeding.
Save the Channel
Once the test succeeds, click Save to create the channel. It will now appear in the channels list and can be referenced by alert rules.
Step 3: Create an Alert Rule
Alert rules define what to monitor and when to send notifications.
Navigate to Alerts Tab

Switch to the Alerts tab and click Create.
Basic Configuration
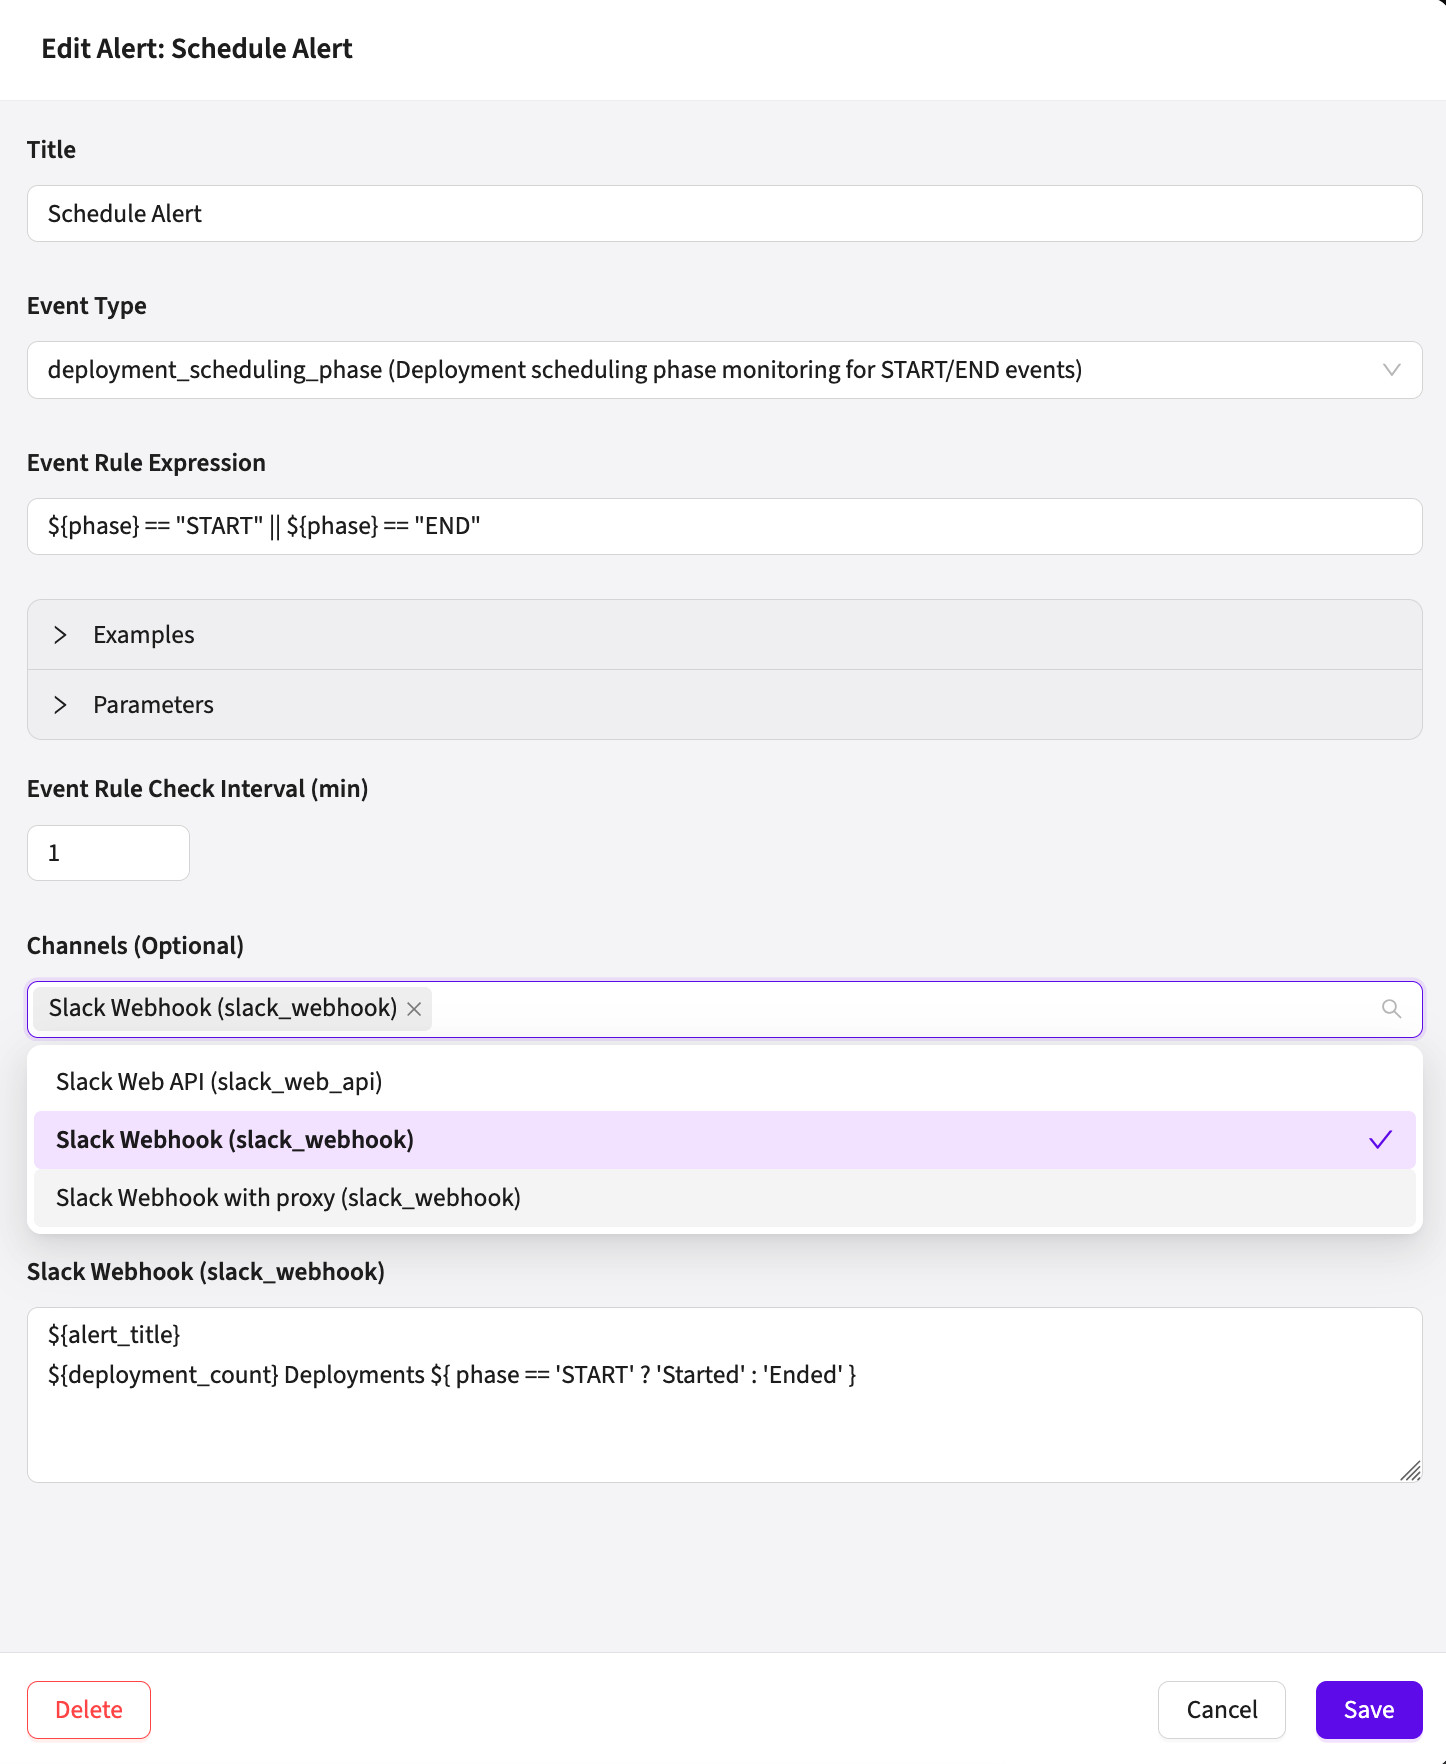
Title - Give your alert a descriptive name
- Good: "Production CPU Over 80% for 5min"
- Avoid: "Alert 1" or "Test"
Event Type - Select what to monitor:
deployment_workload_metrics- CPU/memory metrics over timedeployment_scheduling_phase- START/END lifecycle eventsautopilot_logs_missing- Missing log detectionpending_pod_duration- Pods stuck inPending(Wave 3.4.0+)pod_container_failure- Container failure transitions such asCrashLoopBackOff(3.4.0+)pv_usage- PVC capacity thresholds (3.4.0+)smart_sizing_recommendation- Smart Sizing recommendation drift from current requests (3.4.0+)oom_kill_risk- Real-time OOM-kill risk before the kill happens (3.4.0+)
See the Alert CRDs reference for each event type's rule variables, supported target types, and example rules.
Define Event Targets
Choose which resources this alert monitors:
None - Disable the alert (useful for temporary disable without deletion)
All - Monitor all resources of the type
{
  "all": {
    "resource_type": "deployment"
  }
}
Specific - Monitor selected resources
{
  "specific": [
    {
      "resource_type": "deployment",
      "namespace": "production",
      "name": "web-app"
    },
    {
      "resource_type": "deployment",
      "namespace": "production",
      "name": "api-server"
    }
  ]
}
Write the Rule Expression
The rule expression is a JavaScript expression that evaluates to true (trigger alert) or false (no alert).
Example 1: CPU Alert
${evaluation_period_minutes} >= 5 && ${max(cpu_utilization_arr)} >= 80Triggers when CPU exceeds 80% for at least 5 minutes.
Example 2: Memory Alert
${evaluation_period_minutes} >= 10 && ${avg(memory_utilization_arr)} >= 85Triggers when average memory exceeds 85% over 10 minutes.
Example 3: Combined Alert
${evaluation_period_minutes} >= 5 &&
(${max(cpu_utilization_arr)} >= 90 || ${avg(memory_utilization_arr)} >= 90)
Triggers when either CPU or memory exceeds 90% for 5+ minutes.
Example 4: Deployment Events
${phase} == "START"Triggers when deployments start.
Example 5: Autopilot Logs
${missing_duration_minutes} >= 3Triggers when Autopilot logs are missing for 3+ minutes.
Set Check Interval
Event Rule Check Interval (minutes) - How often to evaluate the rule
1- Check every minute (default, recommended for production)5- Check every 5 minutes (for less critical alerts)15- Check every 15 minutes (for background monitoring)
Lower intervals (1 minute) provide faster alerting but increase system load. For most production use cases, 1-5 minutes is appropriate.
Configure Alert Messages
Add one or more messages to send when the alert triggers. Each message:
- References an Alert Channel (created in Step 2)
- Contains a template with variable interpolation
Example Message Template:
🔴 ${alert_title}

**Workload**: ${namespace}/${workload_name}
**CPU Usage**: ${max(cpu_utilization_arr)}%
**Memory Usage**: ${avg(memory_utilization_arr)}%
**Duration**: ${evaluation_period_minutes} minutes
**Time**: ${alert_time}

[View in Console](https://your-console/app/k8s/workloads)
Available Variables (depends on event type):
${alert_title}- Alert rule title${alert_time}- Trigger timestamp${namespace}- Resource namespace${workload_name}- Workload name${max(cpu_utilization_arr)}- Maximum CPU from array${avg(memory_utilization_arr)}- Average memory from array${phase}- Deployment phase (START/END)${deployment_count}- Number of deployments${missing_duration_minutes}- Log gap duration
Validate the Rule
Before saving, use the Validate button to:
- Check JavaScript syntax
- Verify field usage matches event type
- Preview rendered message template
Fix any validation errors before proceeding.
Save the Alert
Click Save to create the alert rule. It will begin evaluating immediately based on the check interval.
Step 4: Monitor Alert Execution
After creating your alert, monitor its execution to verify it's working correctly.
View Alert Logs
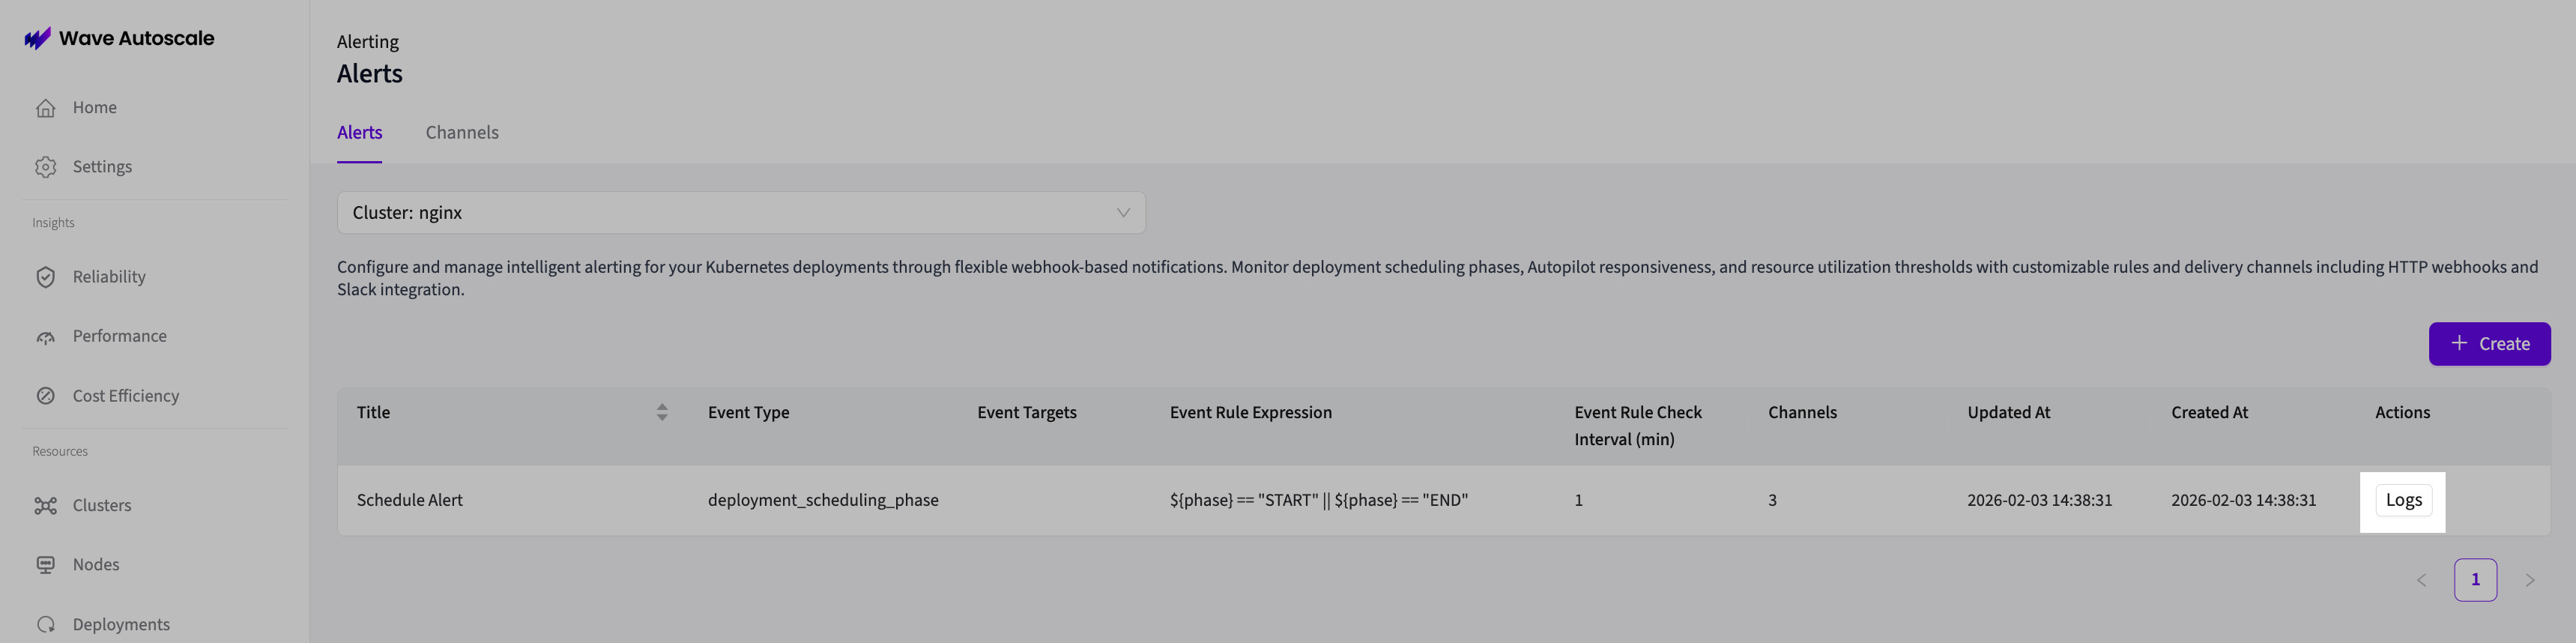
- Navigate to the Alerts tab
- Find your alert in the list
- Click the Logs button
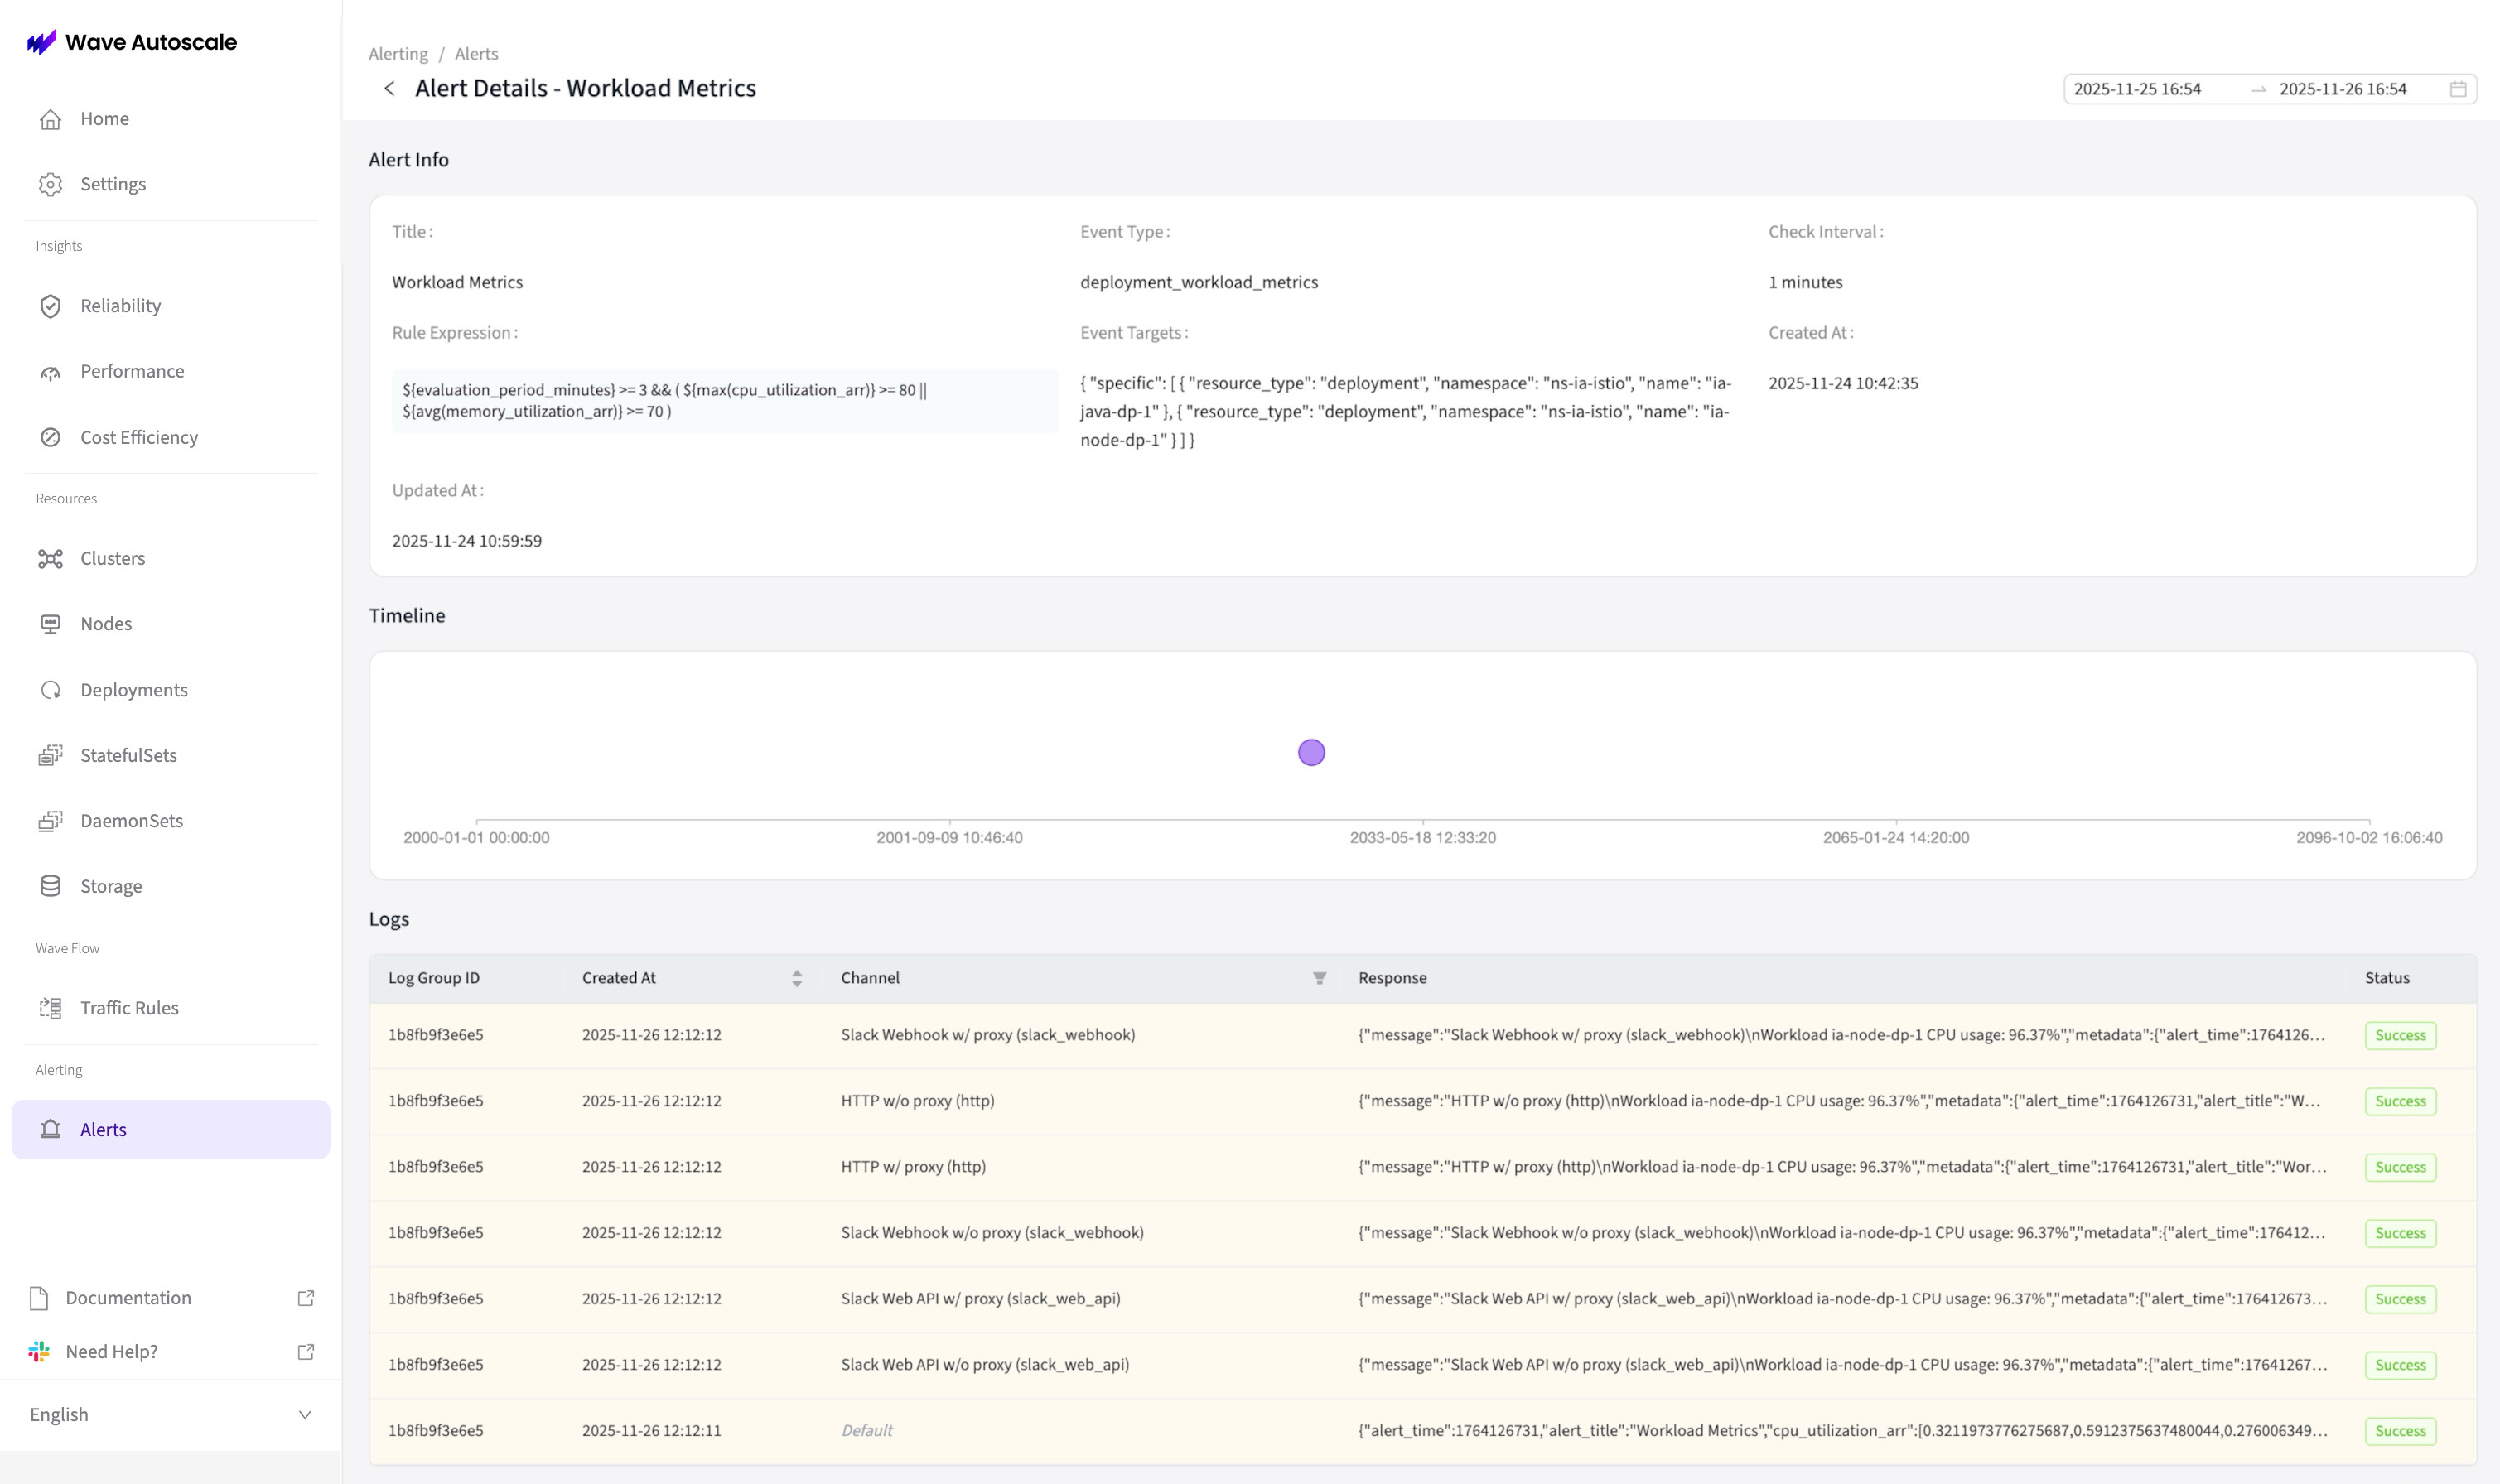
The Alert Logs page shows:
- Timestamp - When the alert triggered
- Alert Title - Which alert fired
- Channel - Where notification was sent
- Status - Success or error
- Response - HTTP response from the endpoint
- Reason - Error details (if failed)
Verify Notifications
Check your notification channels:
- Slack: Look for messages in the configured channel
- HTTP Webhook: Check destination system for received events
- PagerDuty: Verify incident creation
Troubleshooting Failed Alerts
If alerts don't trigger or fail to deliver:
Alert Never Triggers
- Verify rule expression syntax with the validation tool
- Check that event targets match existing resources
- Confirm check interval has elapsed (wait 1-5 minutes)
- Review available fields for the event type
Notification Delivery Fails
- Check Alert Logs for error messages
- Verify channel URL is correct and reachable
- Test authentication headers/tokens are valid
- Confirm network connectivity (try proxy settings if behind firewall)
- Review HTTP response codes (401 = auth error, 404 = wrong URL, 500 = server error)
Too Many Alerts
- Increase check interval to reduce frequency
- Adjust threshold values in rule expression
- Add evaluation period requirement (e.g., must persist 5+ minutes)
Too Few Alerts
- Decrease threshold values to catch more cases
- Reduce evaluation period requirement
- Check event targets include the intended resources
Example Configurations
Production High CPU Alert
Channel: PagerDuty HTTP Webhook
{
  "name": "PagerDuty Production",
  "type": "http",
  "data": {
    "url": "https://events.pagerduty.com/v2/enqueue",
    "method": "POST",
    "headers": {
      "Authorization": "Token token=YOUR_KEY",
      "Content-Type": "application/json"
    }
  }
}Alert:
- Title: Production CPU Critical
- Event Type:
deployment_workload_metrics - Targets: All deployments in
productionnamespace (specific) - Rule:
${evaluation_period_minutes} >= 3 && ${max(cpu_utilization_arr)} >= 90 - Interval: 1 minute
- Message:
🚨 CRITICAL: CPU Alert
Workload: ${namespace}/${workload_name}
CPU: ${max(cpu_utilization_arr)}%
Duration: ${evaluation_period_minutes}min
Action Required: Investigate immediately
Deployment Notification to Slack
Channel: Slack Webhook
{
  "name": "Deployments Channel",
  "type": "slack_webhook",
  "data": {
    "webhook_url": "https://hooks.slack.com/services/YOUR/WEBHOOK/URL"
  }
}Alert:
- Title: Staging Deployments
- Event Type:
deployment_scheduling_phase - Targets: All deployments in
stagingnamespace - Rule:
${phase} == "START" || ${phase} == "END" - Interval: 1 minute
- Message:
📦 Deployment ${phase == "START" ? "Started" : "Ended"}
Count: ${deployment_count} deployment(s)
Namespace: staging
Time: ${alert_time}
Autopilot Monitoring
Channel: Slack Web API
{
  "name": "Autopilot Alerts",
  "type": "slack_web_api",
  "data": {
    "token": "xoxb-your-bot-token",
    "channel": "C1234567890"
  }
}Alert:
- Title: Autopilot Logs Missing
- Event Type:
autopilot_logs_missing - Targets: All deployments
- Rule:
${missing_duration_minutes} >= 5 - Interval: 1 minute
- Message:
⚠️ Autopilot Logs Missing
Workload: ${namespace}/${workload_name}
Missing for: ${missing_duration_minutes} minutes
Action: Check Autopilot pod health
Best Practices
Channel Management
✅ Do:
- Name channels descriptively: "PagerDuty Production", not "Webhook 1"
- Test channels before using them in alerts
- Reuse channels across multiple alerts
- Document authentication credentials securely
❌ Don't:
- Hardcode secrets in channel names
- Create duplicate channels for the same destination
- Use personal Slack DMs for production alerts
Alert Rule Design
✅ Do:
- Use clear, specific alert titles
- Add evaluation periods to avoid flapping (e.g.,
>= 5 minutes) - Include context in message templates (namespace, workload, values)
- Start with conservative thresholds, then tune based on experience
❌ Don't:
- Create alerts without evaluation periods (causes alert storms)
- Use vague titles like "Alert 1" or "Test"
- Alert on every minor threshold breach
- Skip validation before saving
Operational Guidelines
✅ Do:
- Review Alert Logs weekly to identify noisy alerts
- Adjust thresholds based on actual workload behavior
- Disable (target: None) instead of delete during troubleshooting
- Document alert escalation paths for on-call teams
❌ Don't:
- Set check intervals below 1 minute (unnecessary load)
- Create overlapping alerts that duplicate notifications
- Ignore failed alert deliveries in logs
- Configure alerts without testing them first
Next Steps
Now that you've created your first alert:
- Monitor for 24-48 hours - Observe alert frequency and adjust thresholds
- Add More Channels - Set up different destinations for different severity levels
- Create Alert Variants - Configure similar alerts for staging, development clusters
- Integrate with Insights - Use Insights data to inform alert thresholds
- Learn Advanced Patterns - Read How it Works for technical deep-dive
Congratulations! You've configured your first Wave alert. Your cluster is now actively monitored with automatic notifications.