The Sizing Console
The Wave Sizing menu has three pages: Overview (cluster-wide sizing health and a ranked to-do list), Recommendations (every container's current vs recommended values), and Report (a shareable right-sizing summary; see Smart Sizing Report). This page walks through Overview and Recommendations. All three refresh on the same 10-minute analysis cycle: the banner shows the last update time, and Refresh re-fetches on demand. Use the cluster selector to switch clusters.
Overview
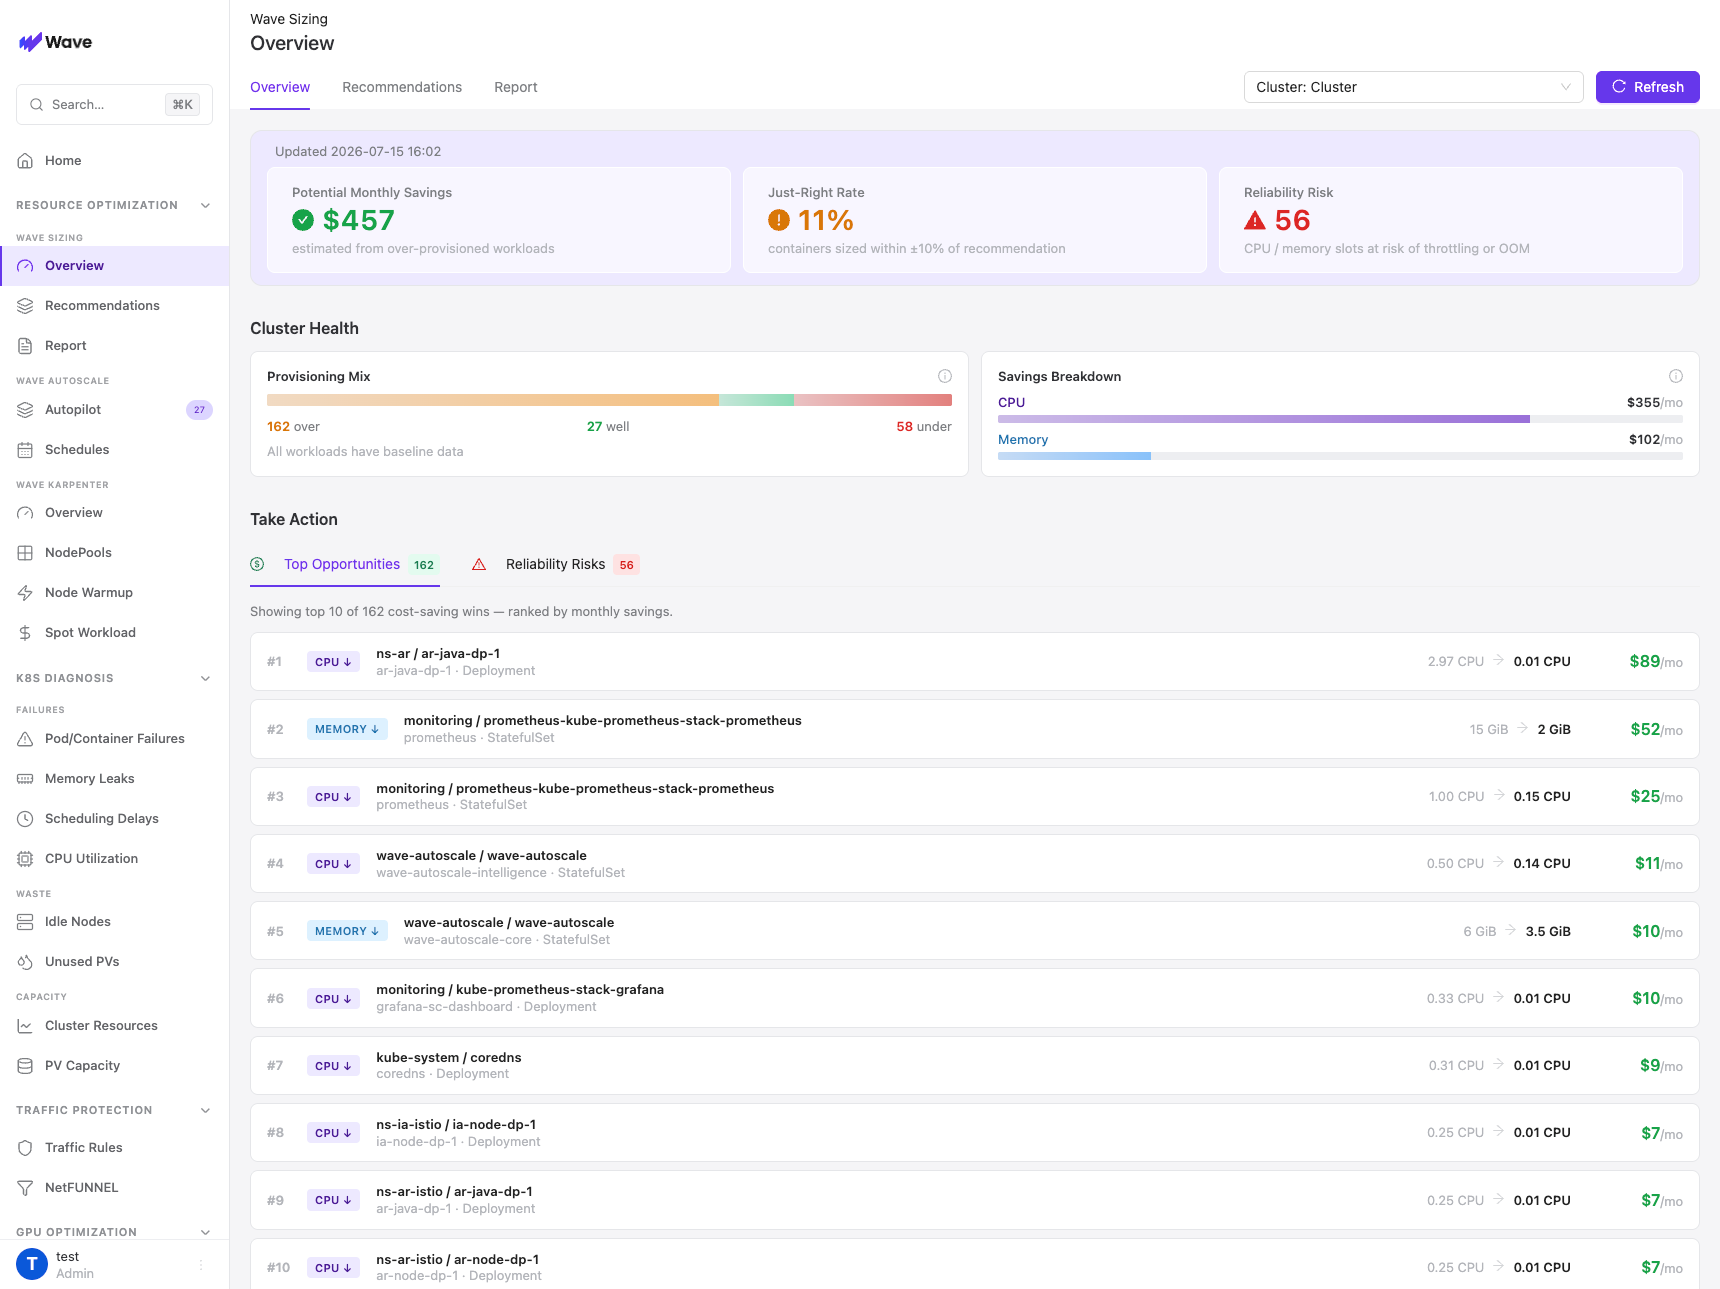
Headline metrics
| Metric | What it means |
|---|---|
| Potential Monthly Savings | Estimated money recoverable from over-provisioned containers: for each container whose recommendation is below its current request, the gap is priced at a market-average rate |
| Just-Right Rate | Percentage of resource slots sized within ±10% of the recommendation. Each container contributes up to two slots: one CPU, one memory |
| Reliability Risk | Count of under-provisioned slots (recommendation more than 10% above the current request) at risk of CPU throttling or OOMKill. Tiny containers below a noise floor (0.2 CPU / 20 MiB) are excluded |
About the dollar amounts. Savings are computed with flat market-average rates per vCPU and per GB of memory. They are meant for prioritization, not billing; your actual rates depend on instance types, committed-use discounts, and platform. Treat them as a relative ranking of where right-sizing pays off most.
Cluster Health
- Provisioning Mix: a stacked bar of all resource slots: over (recommendation more than 10% below request), well (within ±10%), under (more than 10% above), and warming up (gray, workloads without baseline data yet; recommendations arrive in 24-48 hours).
- Savings Breakdown: splits the potential savings into CPU vs memory, so you know whether right-sizing efforts should focus on compute or memory.
Take Action
Two ranked lists; clicking any row opens that workload's Smart Sizing tab.
- Top Opportunities: over-provisioned containers ranked by estimated monthly savings (top 10 shown).
- Reliability Risks: under-provisioned containers ranked by severity (how far usage-based recommendations exceed the current request, e.g.
2.5× over request). These are throttling/OOMKill candidates; handle them before chasing savings.
Recommendations
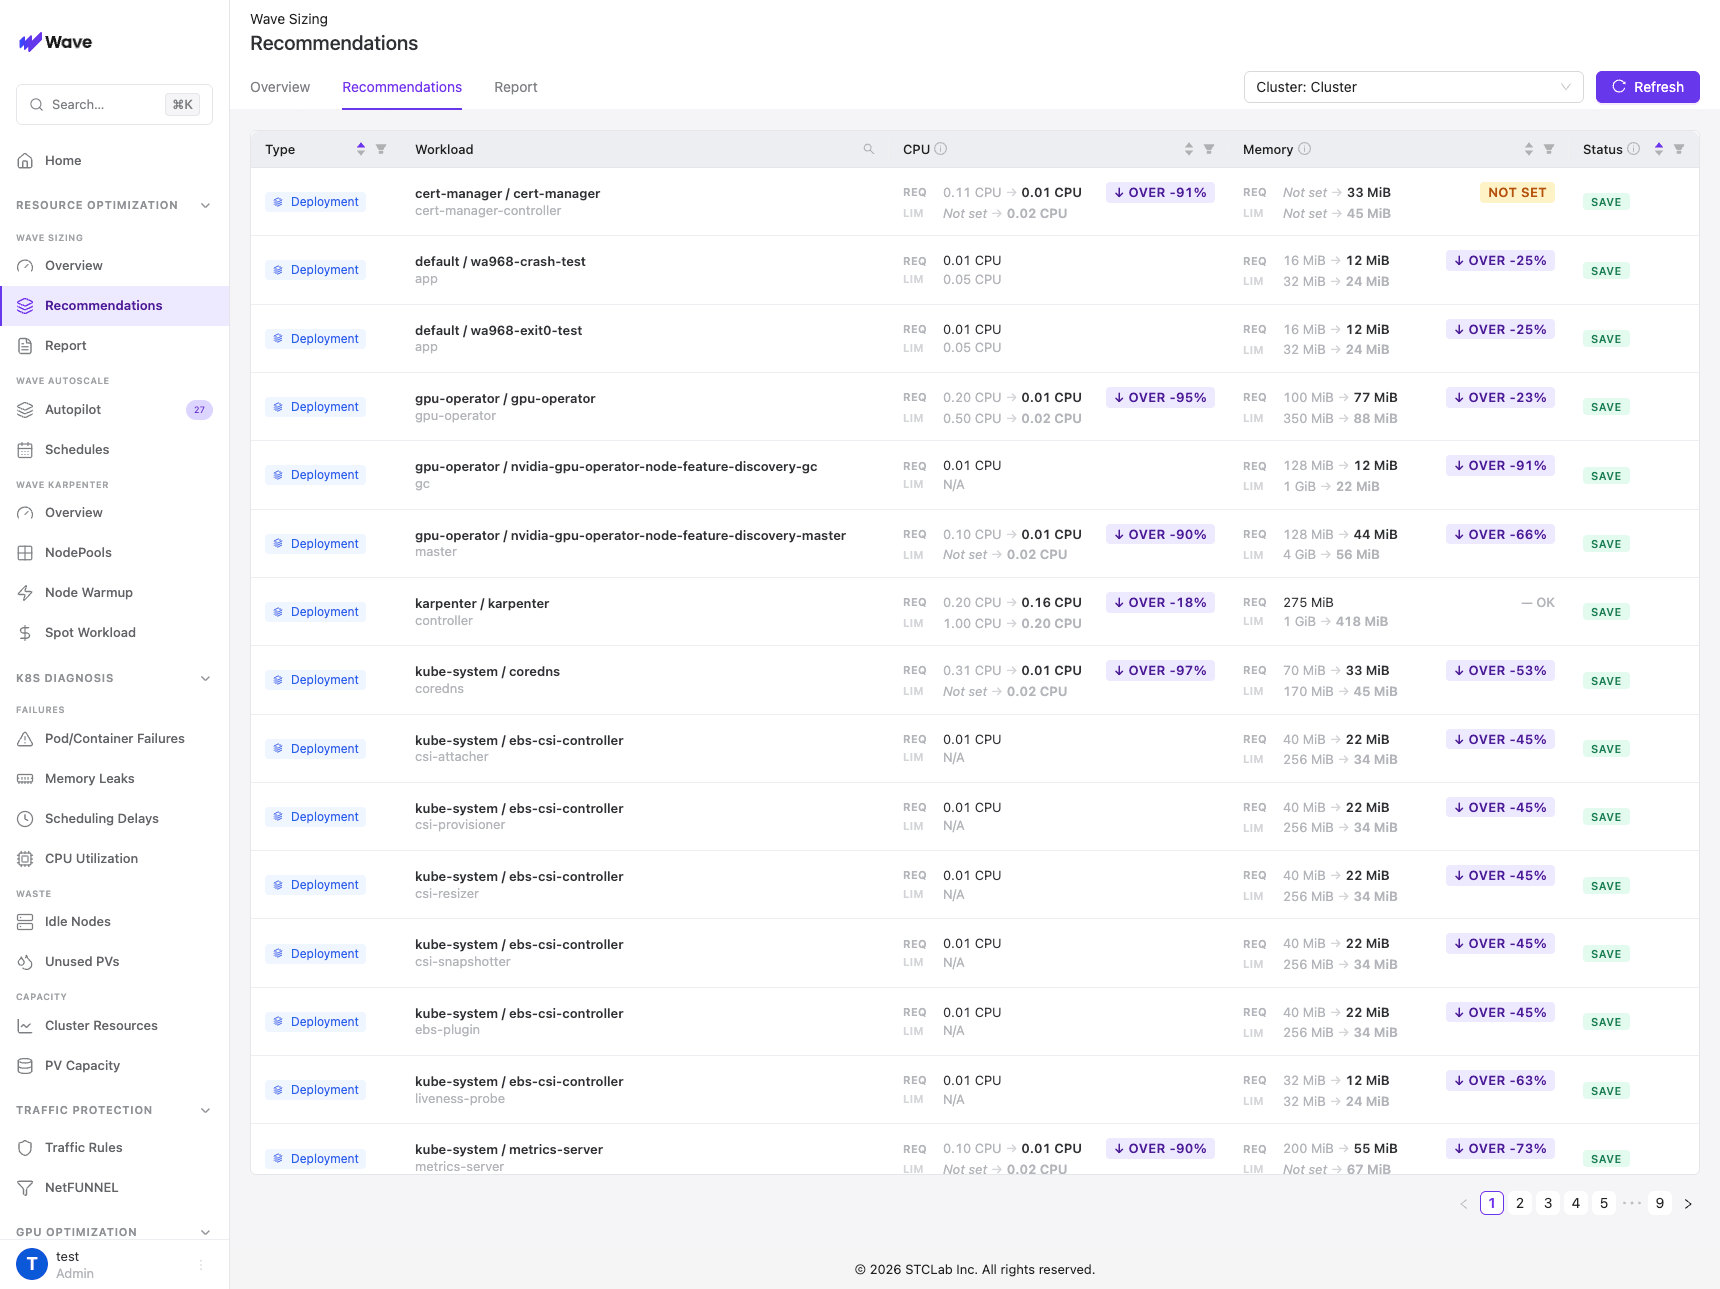
One row per container. All supported kinds appear: Deployment, StatefulSet, DaemonSet, Argo Rollout, and OpenShift DeploymentConfig. Columns are sortable and filterable, and the Workload column has free-text search over namespace, workload, and container names.
CPU / Memory columns
Each cell shows two lines, REQ (request) and LIM (limit), as current → recommended transitions. The badge on the request line classifies it:
| Badge | Meaning |
|---|---|
| OVER −N% | Recommendation is more than 10% below the current request, over-provisioned by N% |
| UNDER +N% | Recommendation is more than 10% above the current request, under-provisioned |
| OK | Within ±10% of the recommendation |
| NOT SET | The container has no request configured, but a recommendation exists |
Status column
The CPU and memory classifications combine into one workload-level status:
| Status | Meaning |
|---|---|
| SAVE | Over-provisioned: applying the recommendation saves money |
| RISK | Under-provisioned: reliability risk, act first |
| RISK + SAVE | One resource under-provisioned, the other over-provisioned |
| OK | Sized correctly |
| UNCONFIGURED | Requests not set: set a baseline from the recommendation |
| WARMING UP | Not enough data for a recommendation yet |
Click a row to open the workload's Smart Sizing tab and act on it.
Report
The Report page is a shareable, print-ready cluster right-sizing summary: AS-IS vs TO-BE savings, an efficiency rate, and per-workload opportunities and risks. It has its own page: Smart Sizing Report.