Karpenter Dashboard
The Karpenter Dashboard provides real-time visibility into all Karpenter-provisioned nodes across your NodePools. Navigate to Karpenter > Overview in the sidebar to access the dashboard.
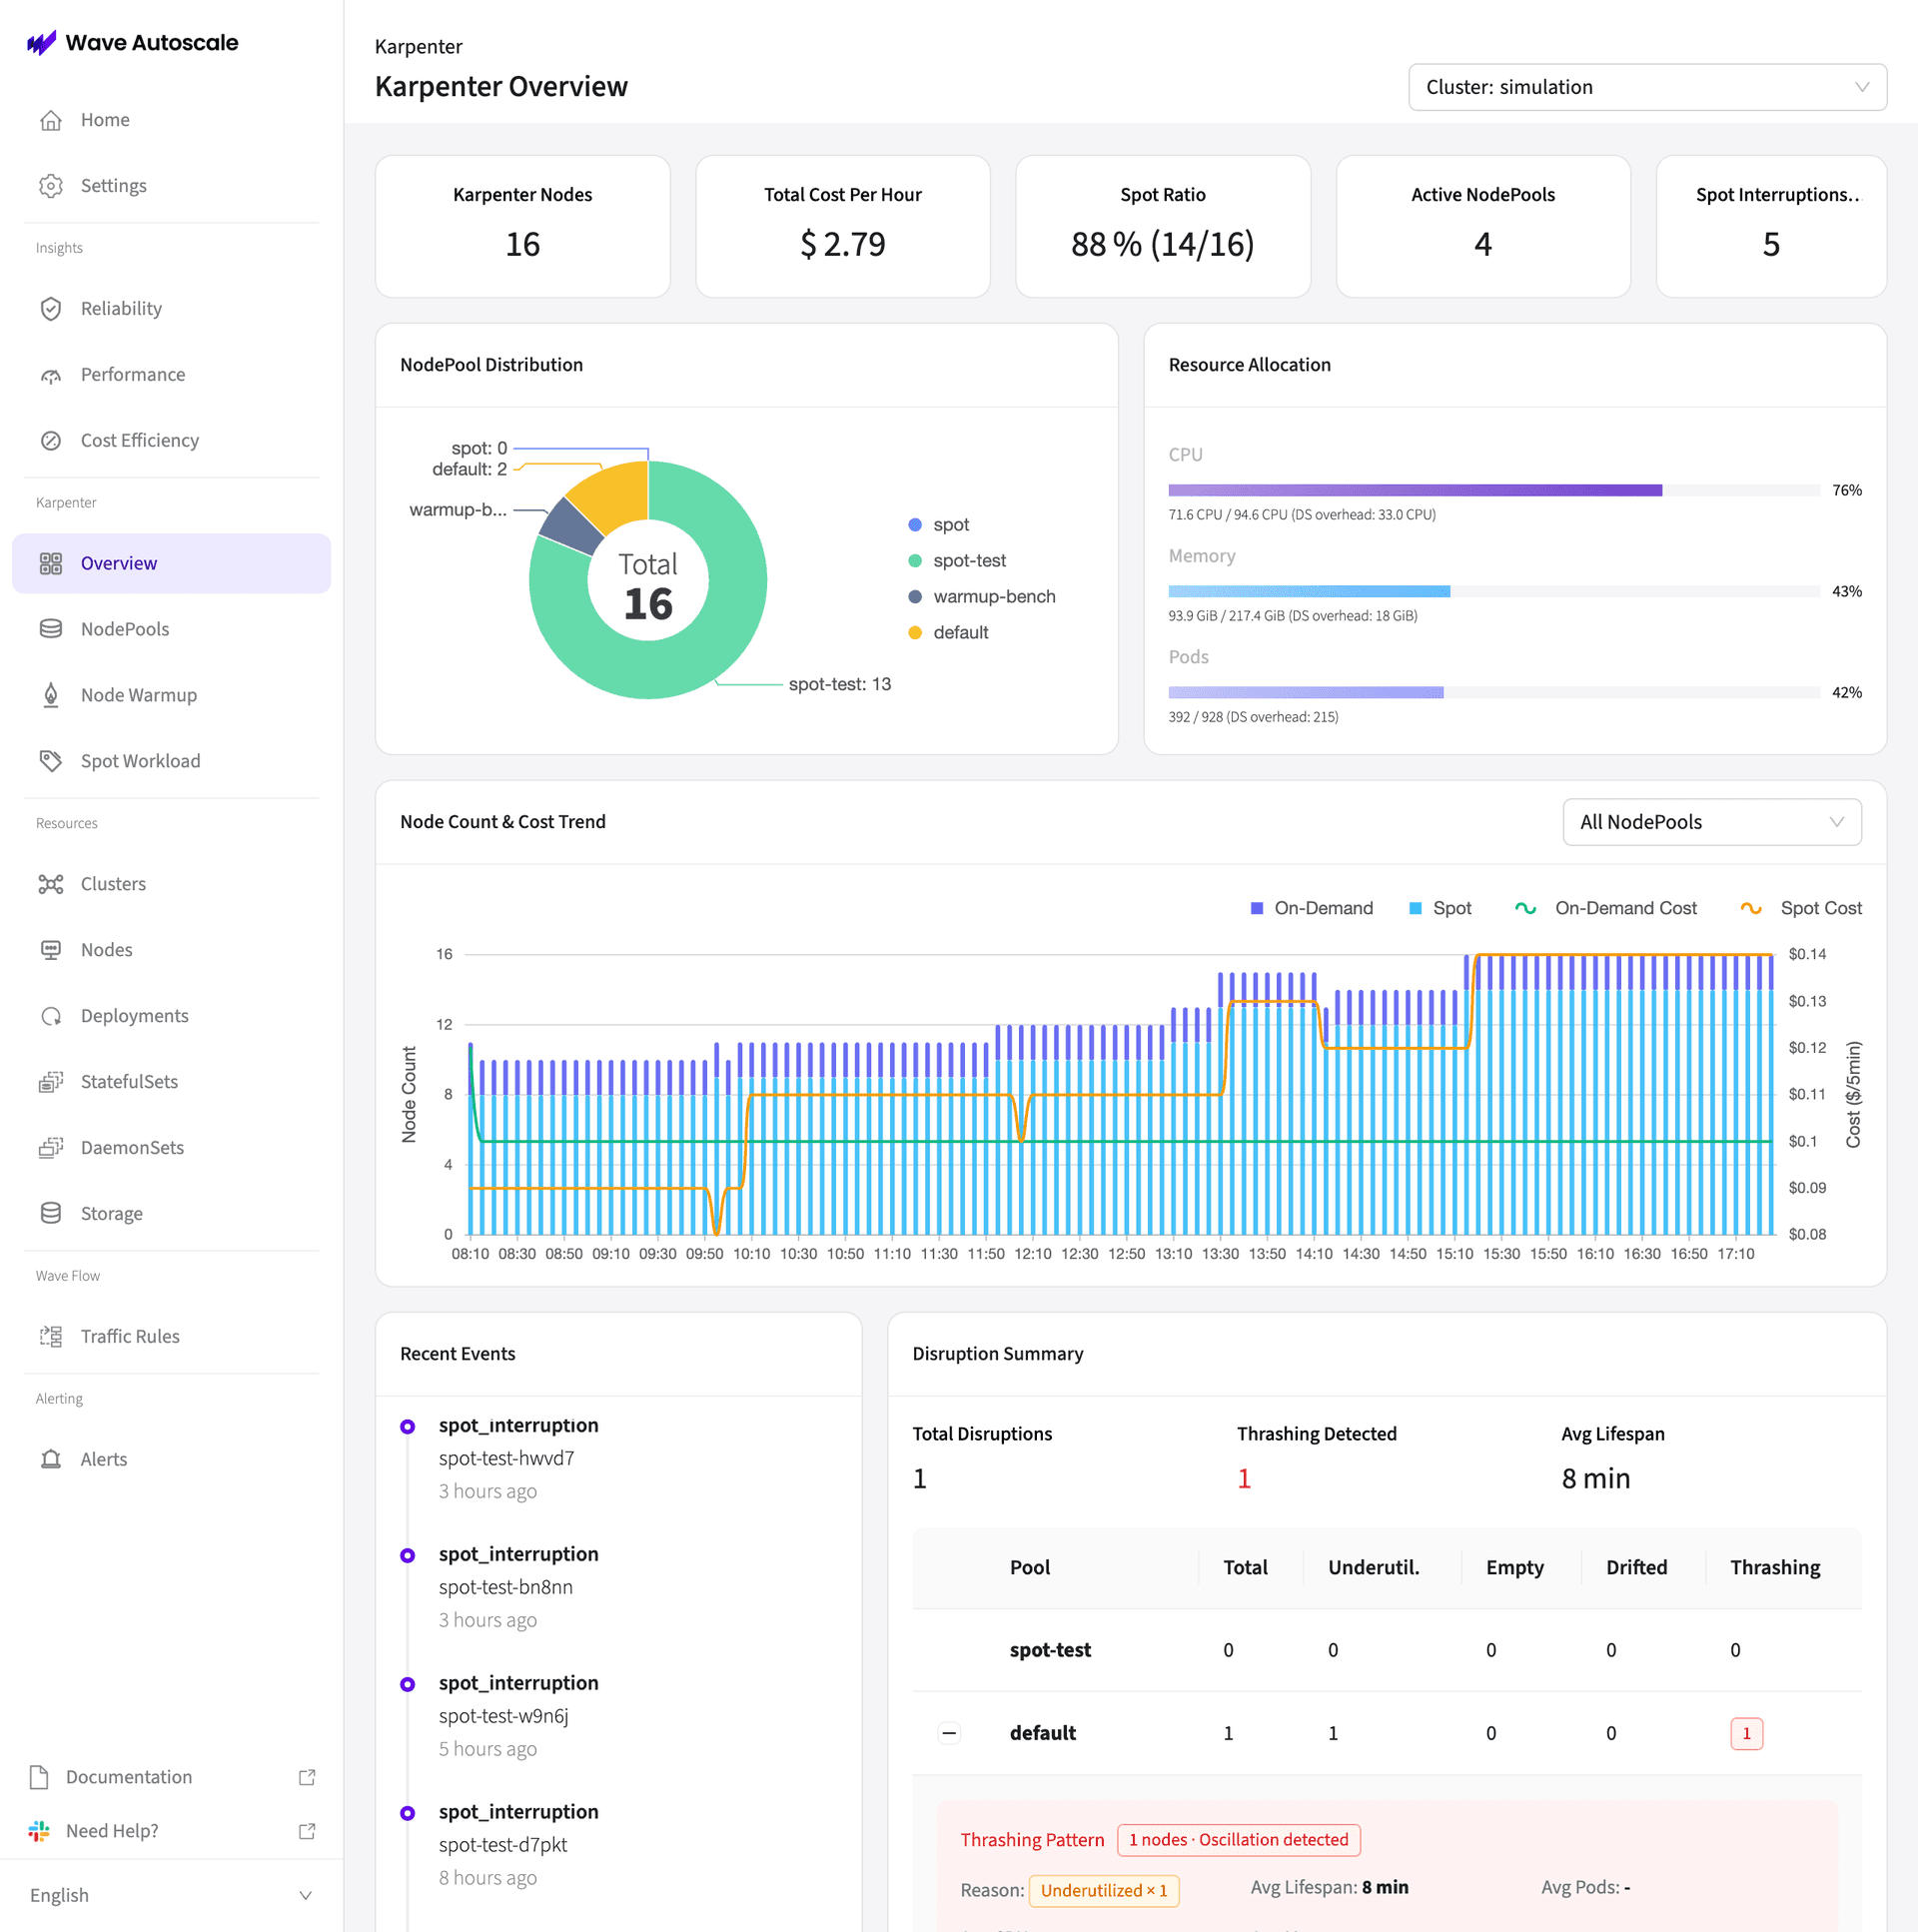
Overview Page
The Overview page displays top-level metrics at a glance:
| Metric | Description |
|---|---|
| Karpenter Nodes | Total active nodes provisioned by Karpenter |
| Total Cost Per Hour | Estimated hourly cost across all Karpenter nodes |
| Spot Ratio | Percentage of nodes on Spot vs. On-Demand (e.g., 88% 14/16) |
| Active NodePools | Number of active NodePools |
| Spot Interruptions | Count of recent spot interruption events |
Below the metrics, the Overview shows:
- NodePool Distribution — Donut chart showing node allocation per NodePool
- Resource Allocation — CPU, Memory, and Pod utilization bars with overhead visibility
- Node Count & Cost Trend — Time-series chart tracking On-Demand/Spot node counts and costs over time
- Recent Events — Latest disruption and spot interruption events
- Disruption Summary — Total disruptions, thrashing detection status, and per-pool breakdown
NodePools
Navigate to Karpenter > NodePools to see all NodePools in a table view.
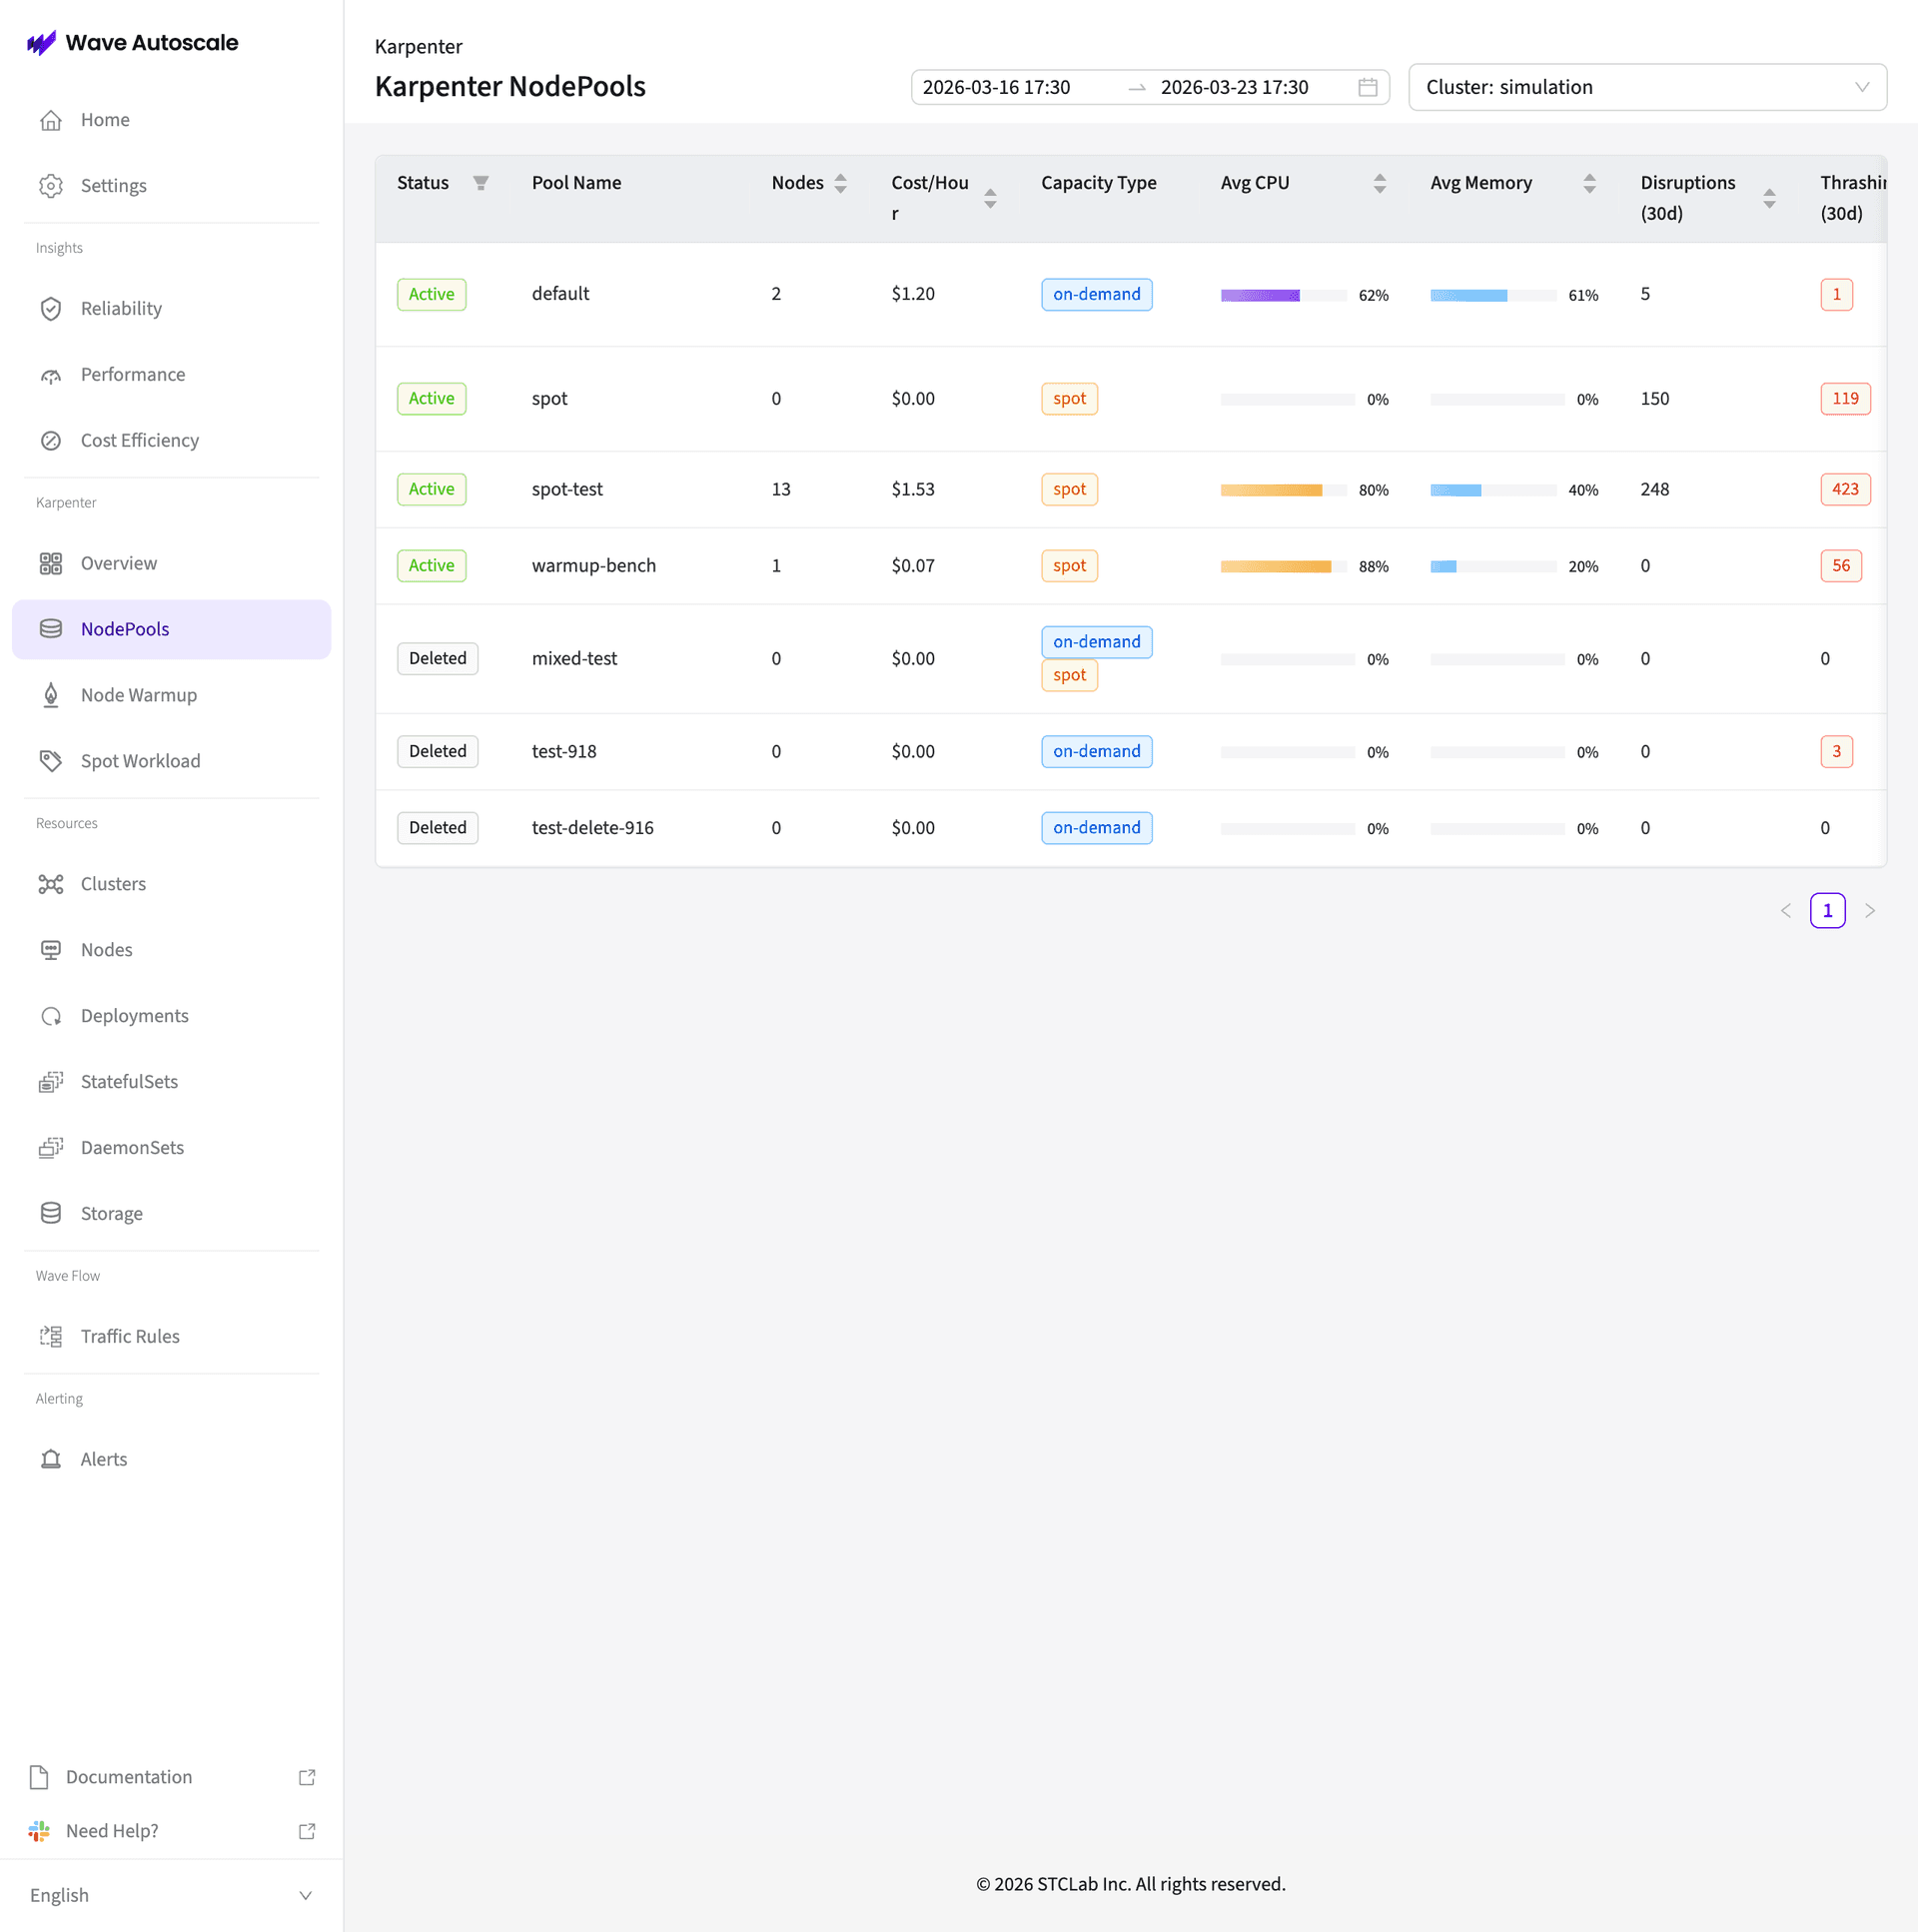
The table displays:
- Status — Active or Deleted
- Pool Name — Karpenter NodePool name
- Nodes — Current node count
- Cost/Hour — Hourly cost for the NodePool
- Capacity Type — On-Demand, Spot, or mixed
- Avg CPU / Avg Memory — Resource utilization bars
- Disruptions (30d) — Disruption count in the last 30 days
- Thrashing (30d) — Thrashing event count
Click on any NodePool row to drill into its detail page.
NodePool Detail — Info Tab
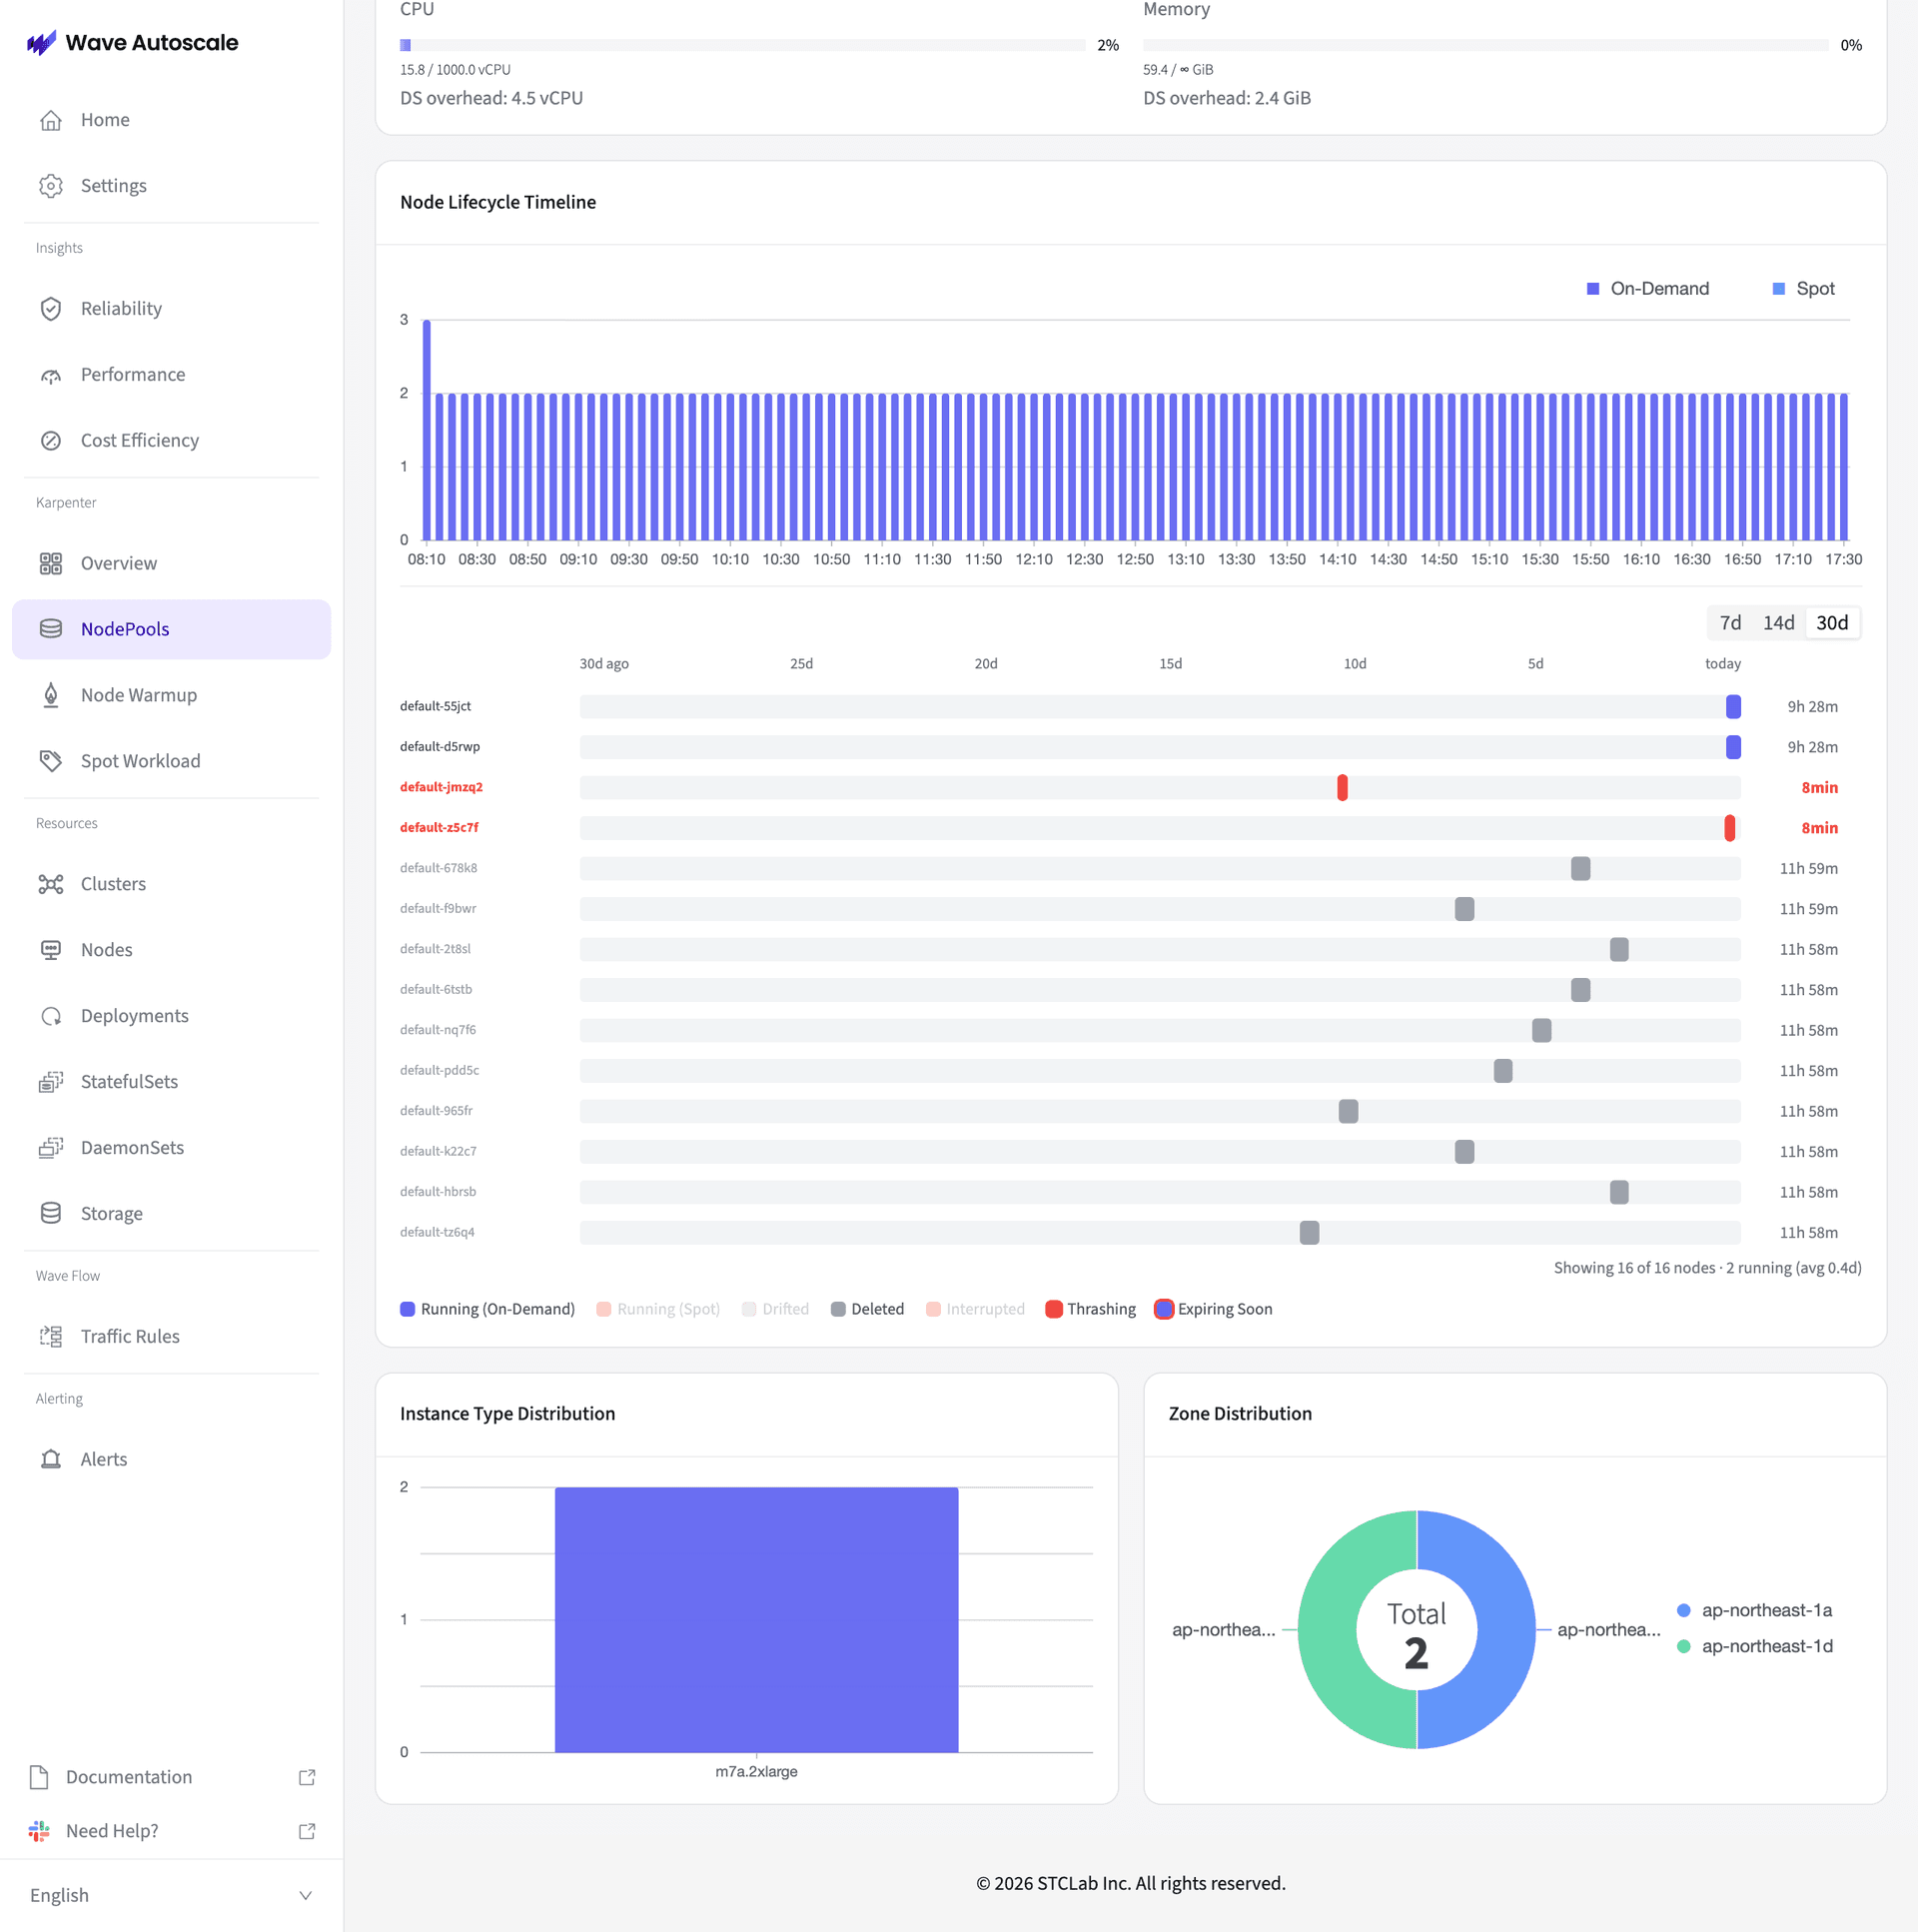
The Info tab shows:
- Resource Allocation — CPU, Memory utilization with OS overhead
- Node Lifecycle Timeline — Visual timeline showing each node's lifespan (On-Demand in blue, Spot in purple, Deleted in gray, Thrashing in red)
- Instance Type Distribution — Bar chart of instance types in use
- Zone Distribution — Donut chart showing AZ spread
NodePool Detail — NodeClaims Tab
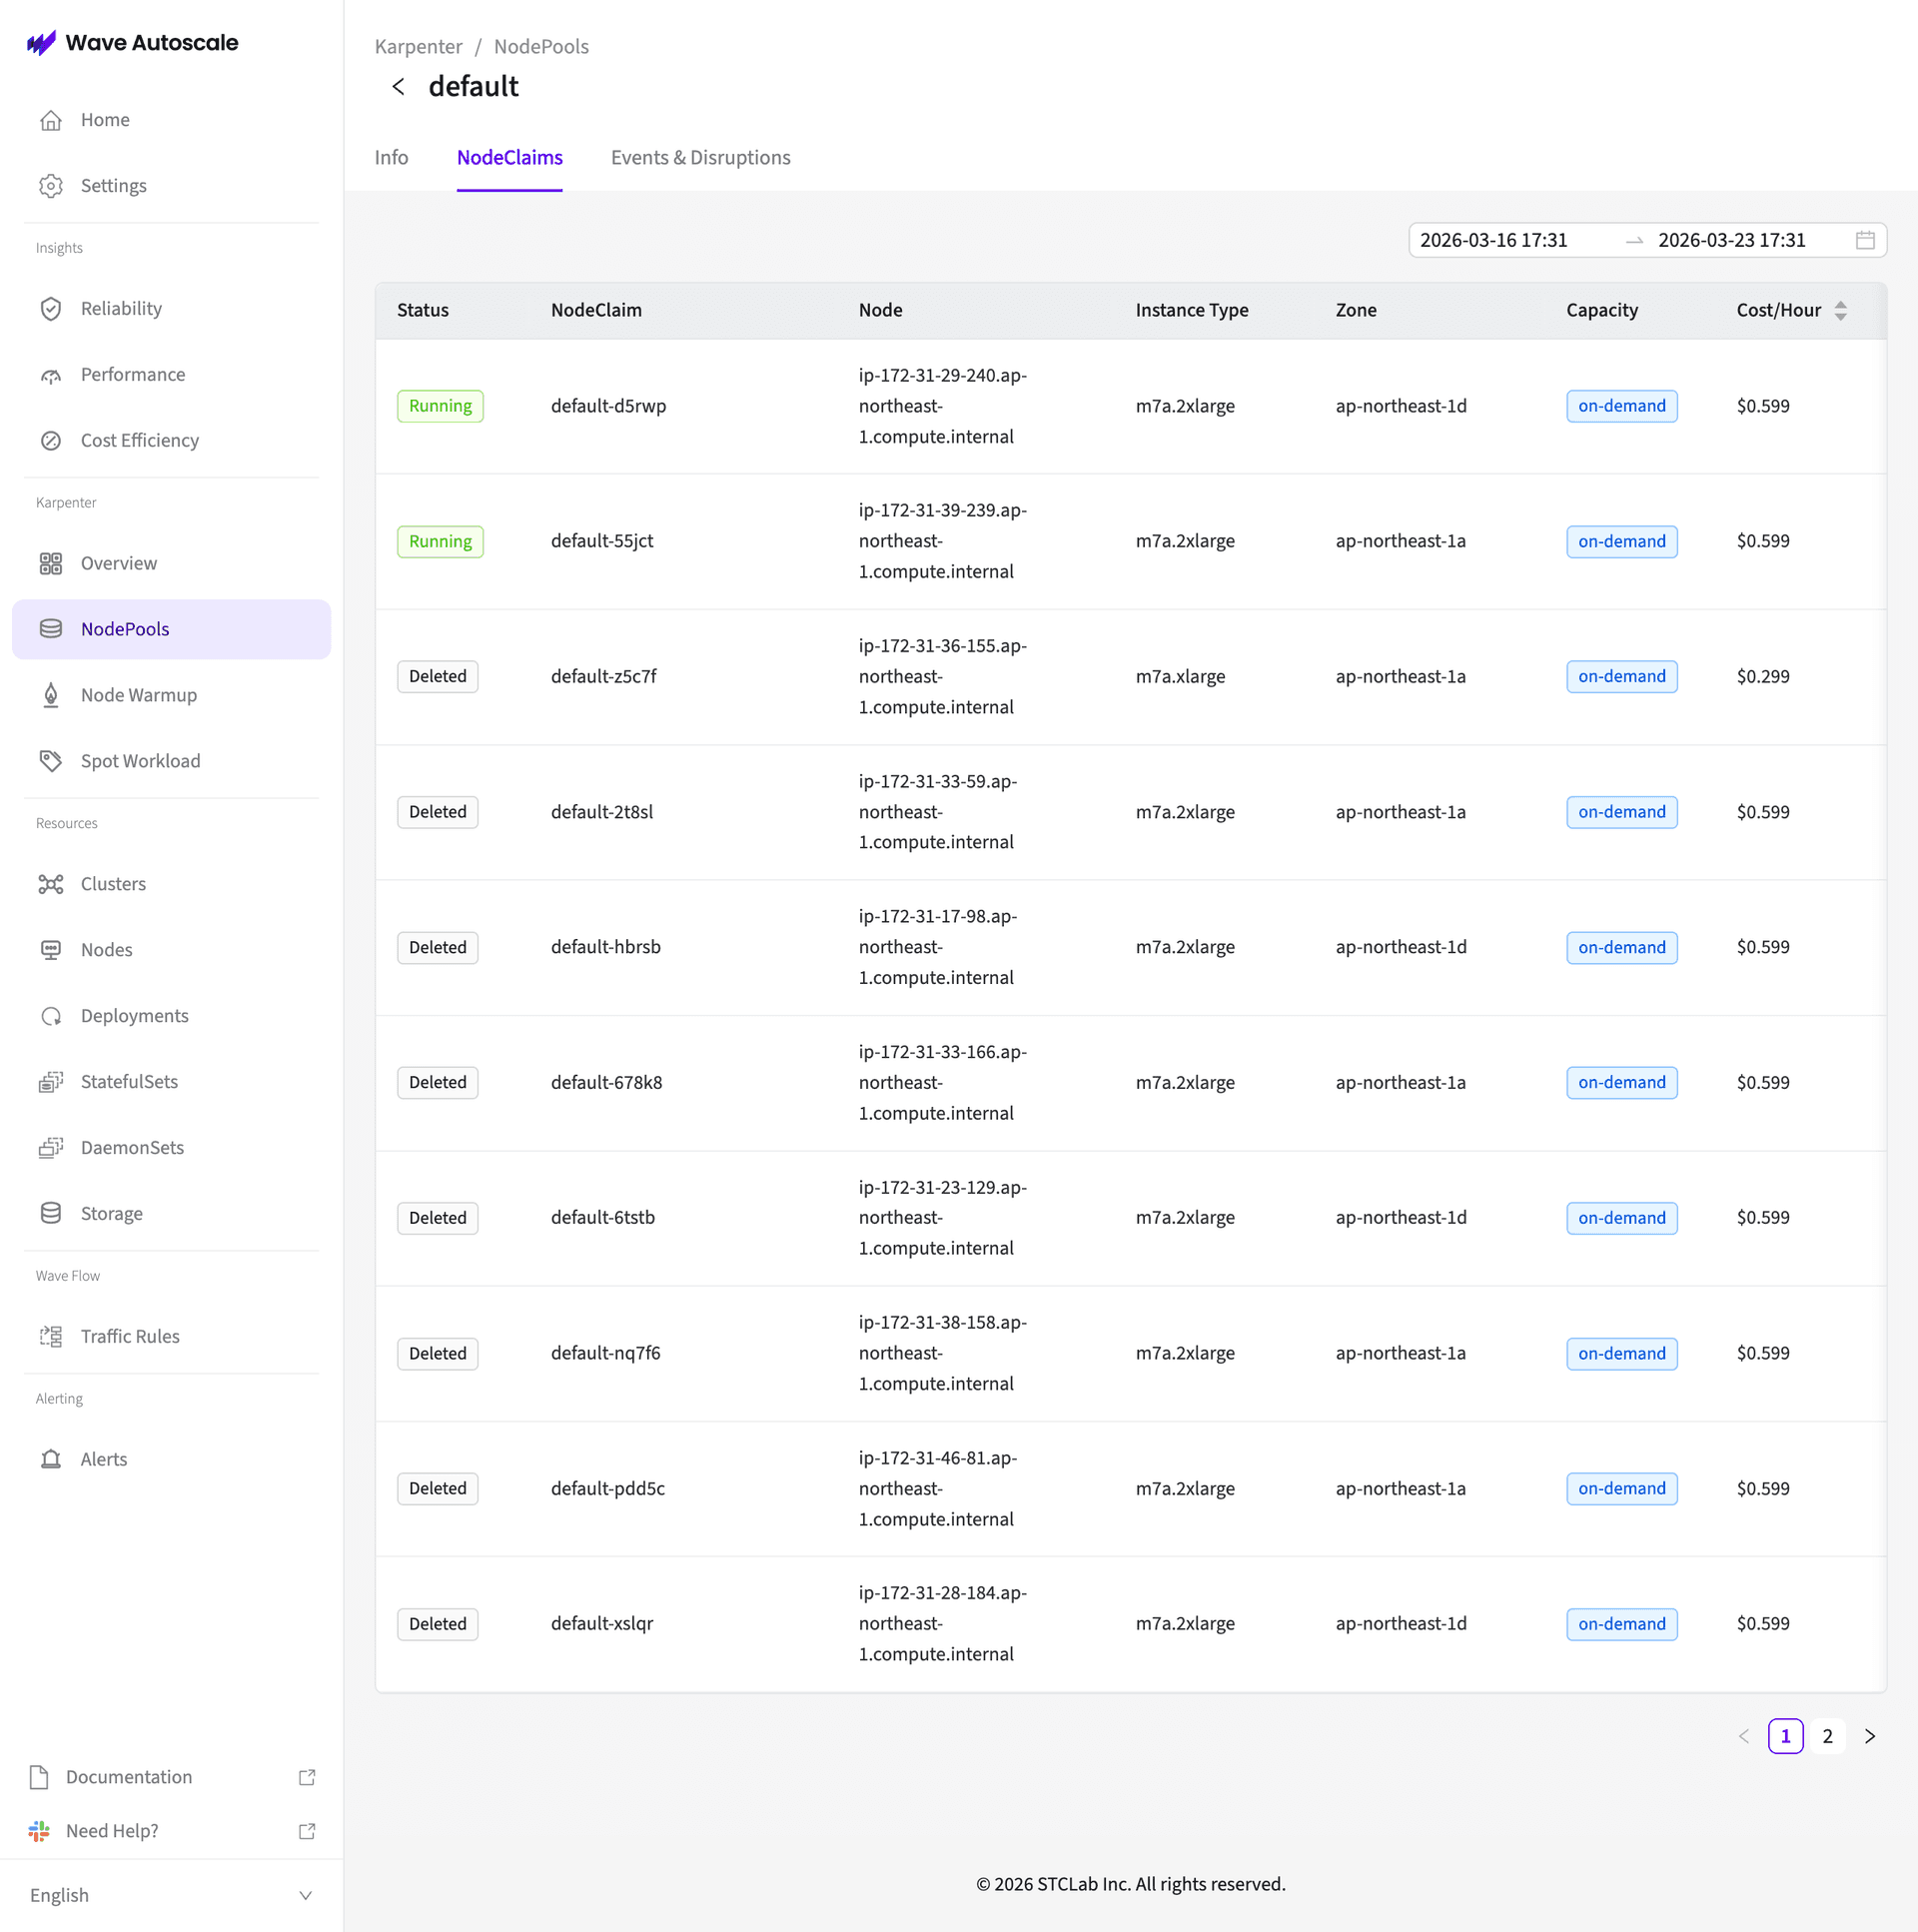
Lists all NodeClaims (Running and Deleted) with:
- Status — Running or Deleted
- NodeClaim — Karpenter NodeClaim name
- Node — Kubernetes node name and IP
- Instance Type — EC2 instance type
- Zone — Availability zone
- Capacity — On-Demand or Spot
- Cost/Hour — Per-node cost
Click on any NodeClaim row to open a detail sidebar:
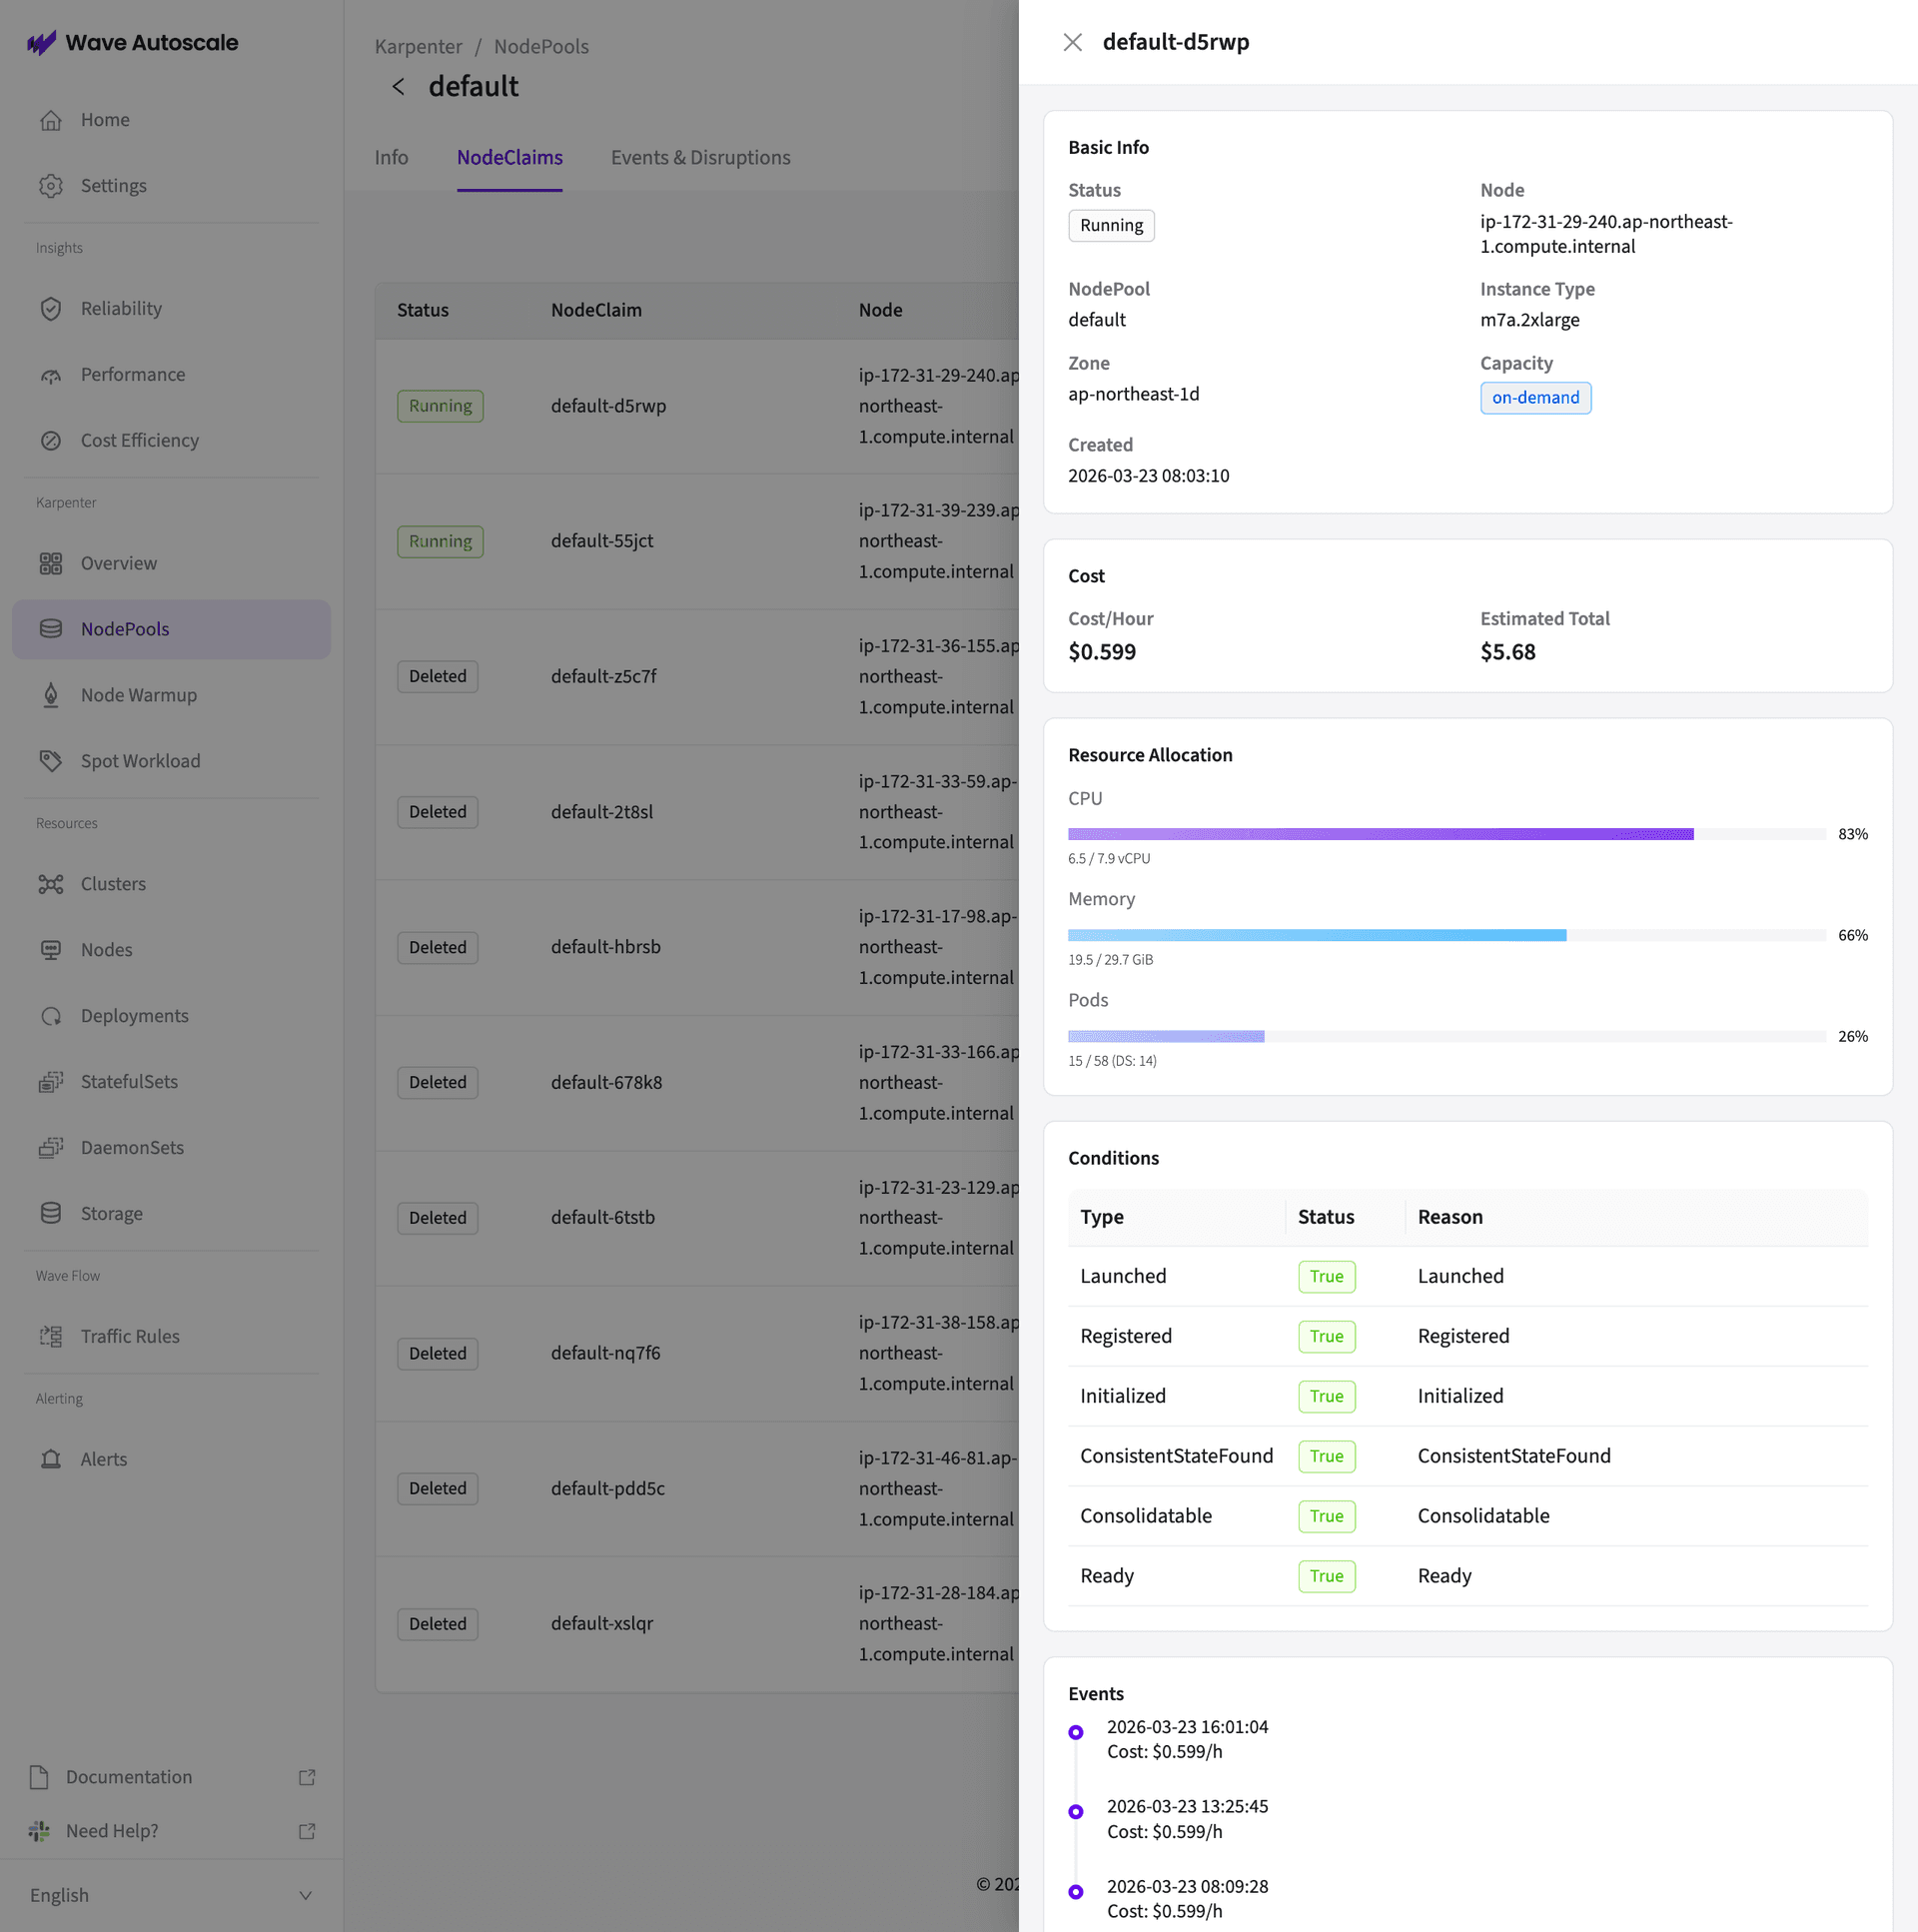
The sidebar shows:
- Basic Info — Status, Node, NodePool, Instance Type, Zone, Capacity, Created timestamp
- Cost — Cost/Hour and Estimated Total
- Resource Allocation — CPU, Memory, Pods utilization bars
- Conditions — Launched, Registered, Initialized, ConsistentStateFound, Consolidatable, Ready statuses
- Events — Cost history events with timestamps
NodePool Detail — Events & Disruptions Tab
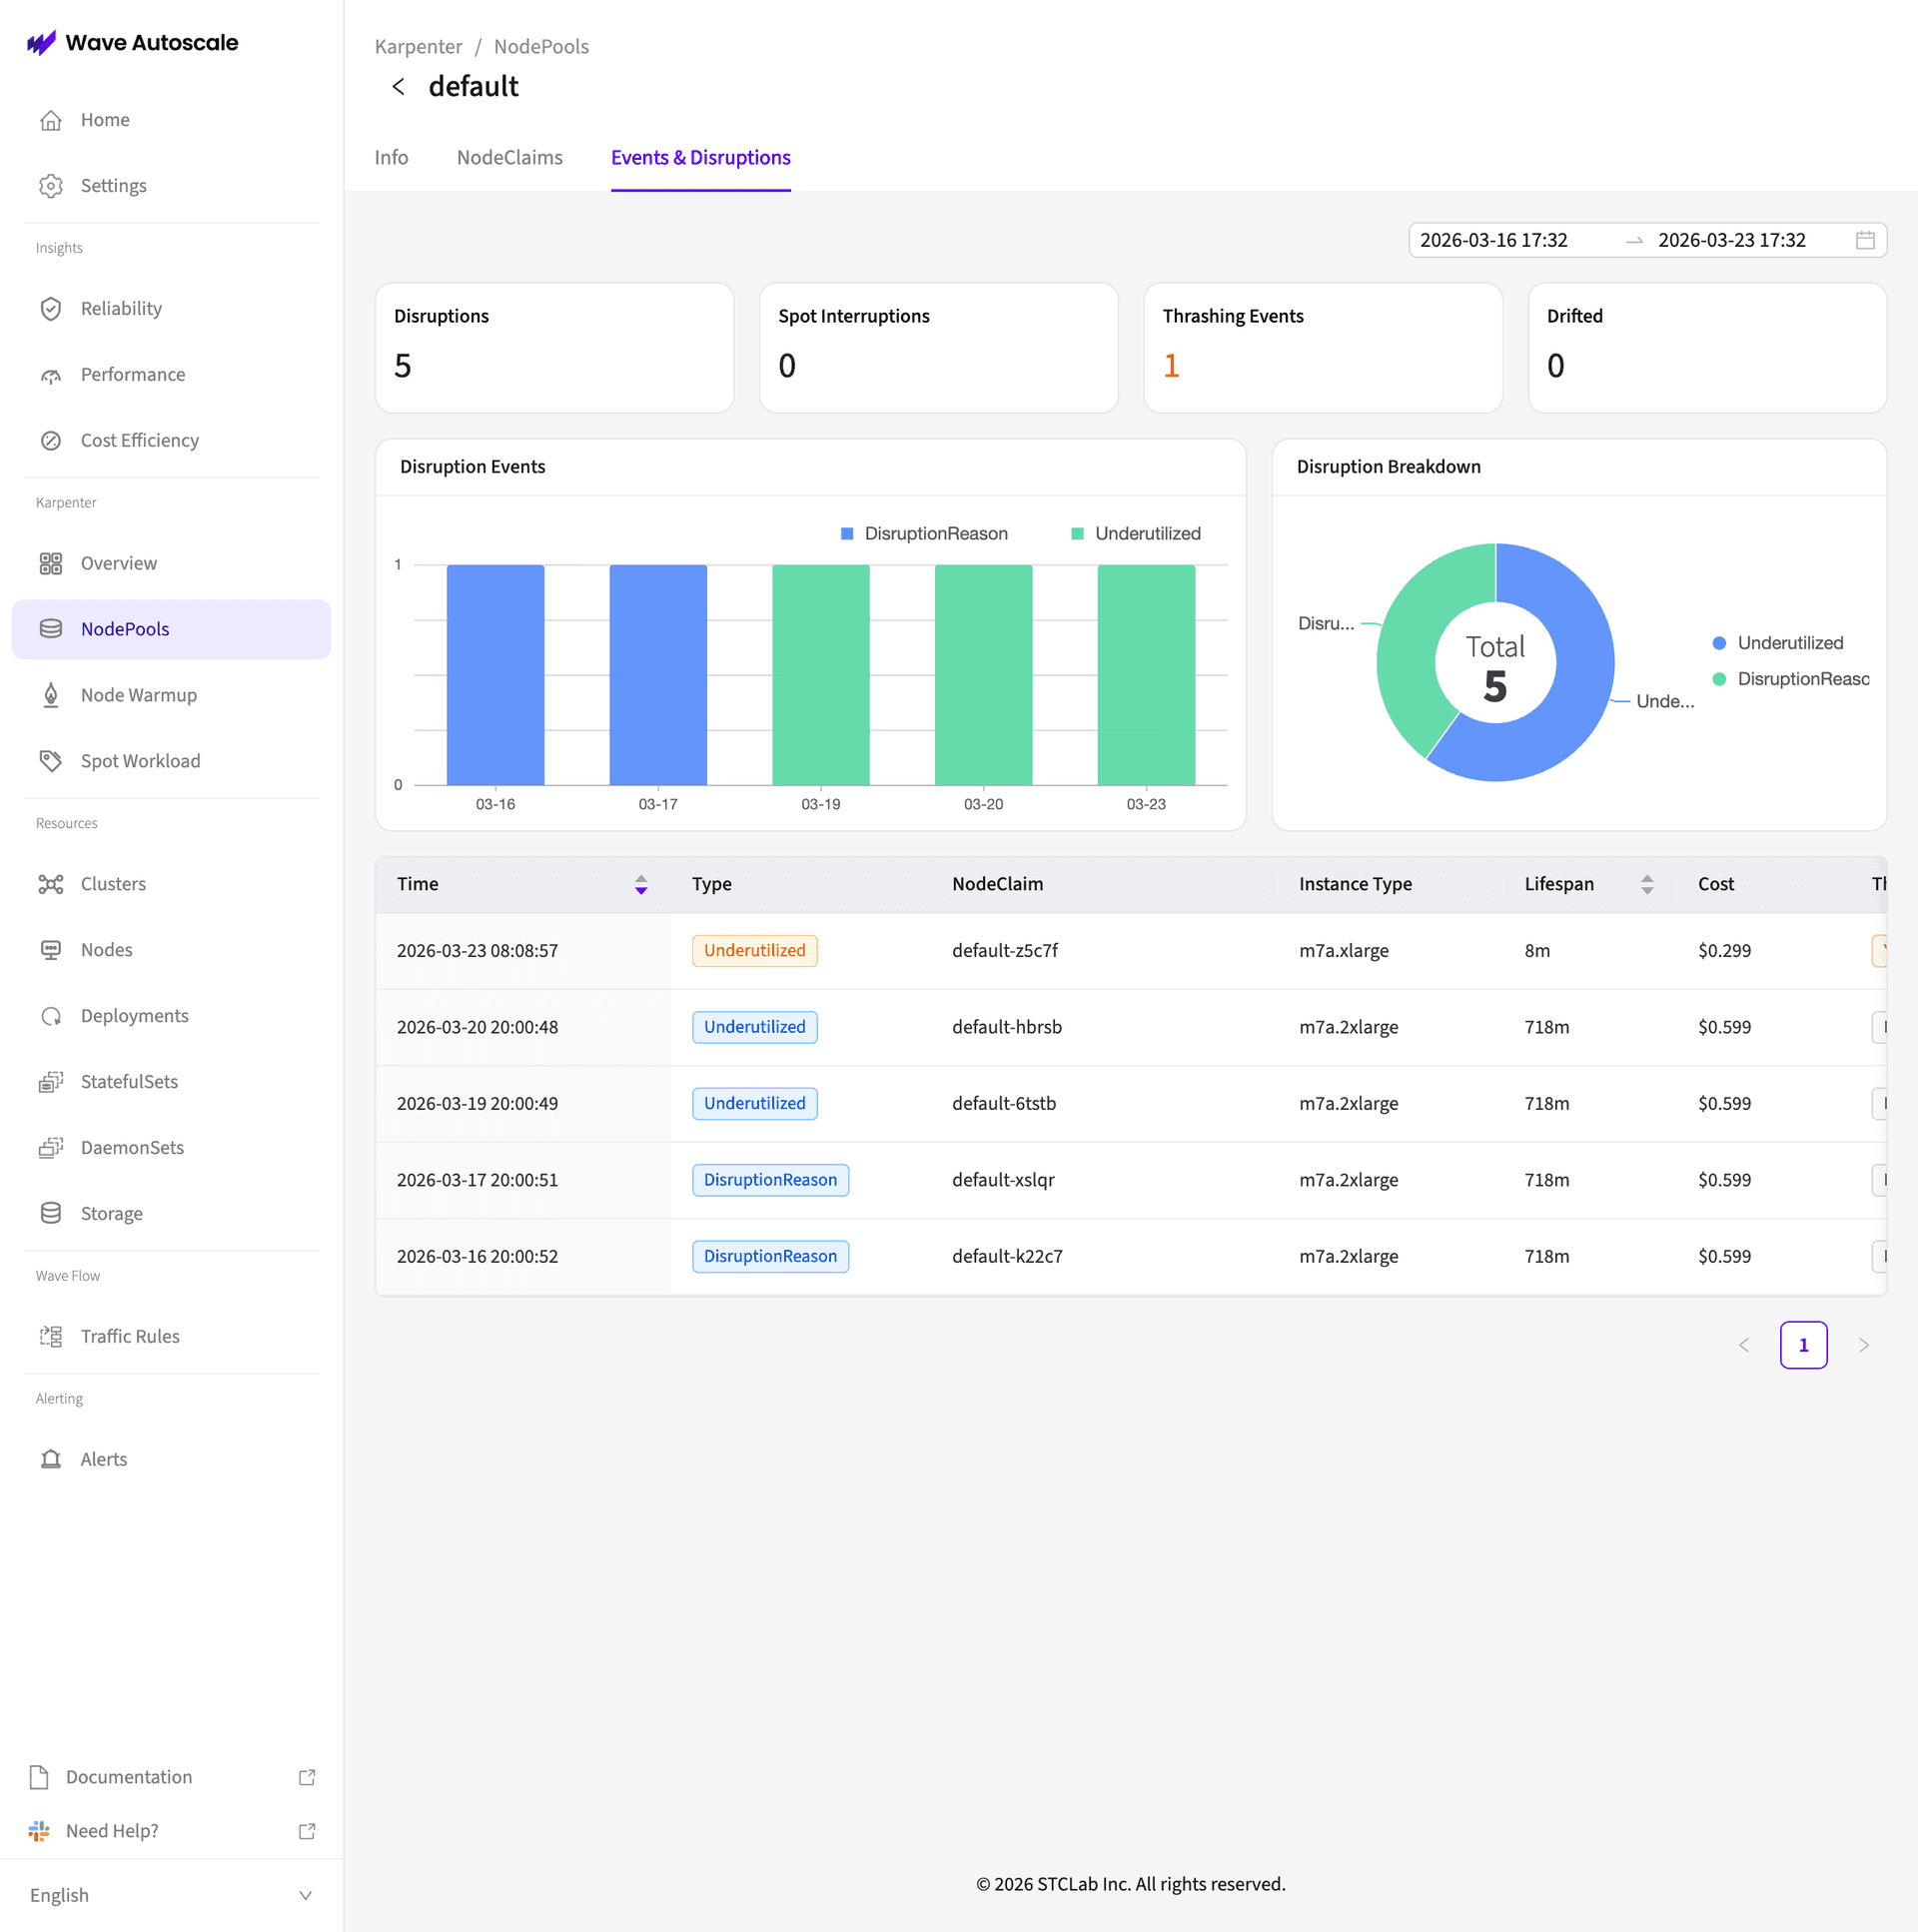
Tracks all disruption activity for the NodePool:
- Summary metrics — Disruptions, Spot Interruptions, Thrashing Events, Drifted counts
- Disruption Events — Bar chart over time
- Disruption Breakdown — Donut chart by type (Underutilized, DisruptionReason)
- Events table — Time, Type, NodeClaim, Instance Type, Lifespan, Cost
Thrashing Detection
The dashboard automatically detects node thrashing — nodes being repeatedly created and destroyed in rapid succession. When detected, the Overview page shows a Thrashing Pattern alert with:
- Number of affected nodes
- Reason (e.g., "Oscillation detected")
- Average lifespan of thrashed nodes
- Average pods affected
| Cause | Description |
|---|---|
| Tight Constraints | NodePool requirements too restrictive — nodes provisioned then immediately consolidated |
| Conflicting Policies | Multiple NodePools or scheduling rules compete, causing provision/remove cycles |
| Scheduling Conflicts | Pod affinity/anti-affinity or topology spread constraints prevent stable placement |
Related
- Getting Started — Install and configure Karpenter integration
- Node Warmup — Proactive node provisioning to reduce pod startup latency
- Spot Workload Placement — Automatic spot/on-demand splitting for cost optimization