Smart Sizing Report
Draft: this page is being finalized.
The Smart Sizing Report turns Wave Sizing's analysis into a single, shareable view of how a cluster's resource requests compare to real usage, and how much you could save by adopting the recommendations. It answers three questions at a glance: how over- or under-provisioned are we, what would right-sizing change, and what does it cost today versus after?
If you have not set up Smart Sizing yet, start with the Smart Sizing Overview.
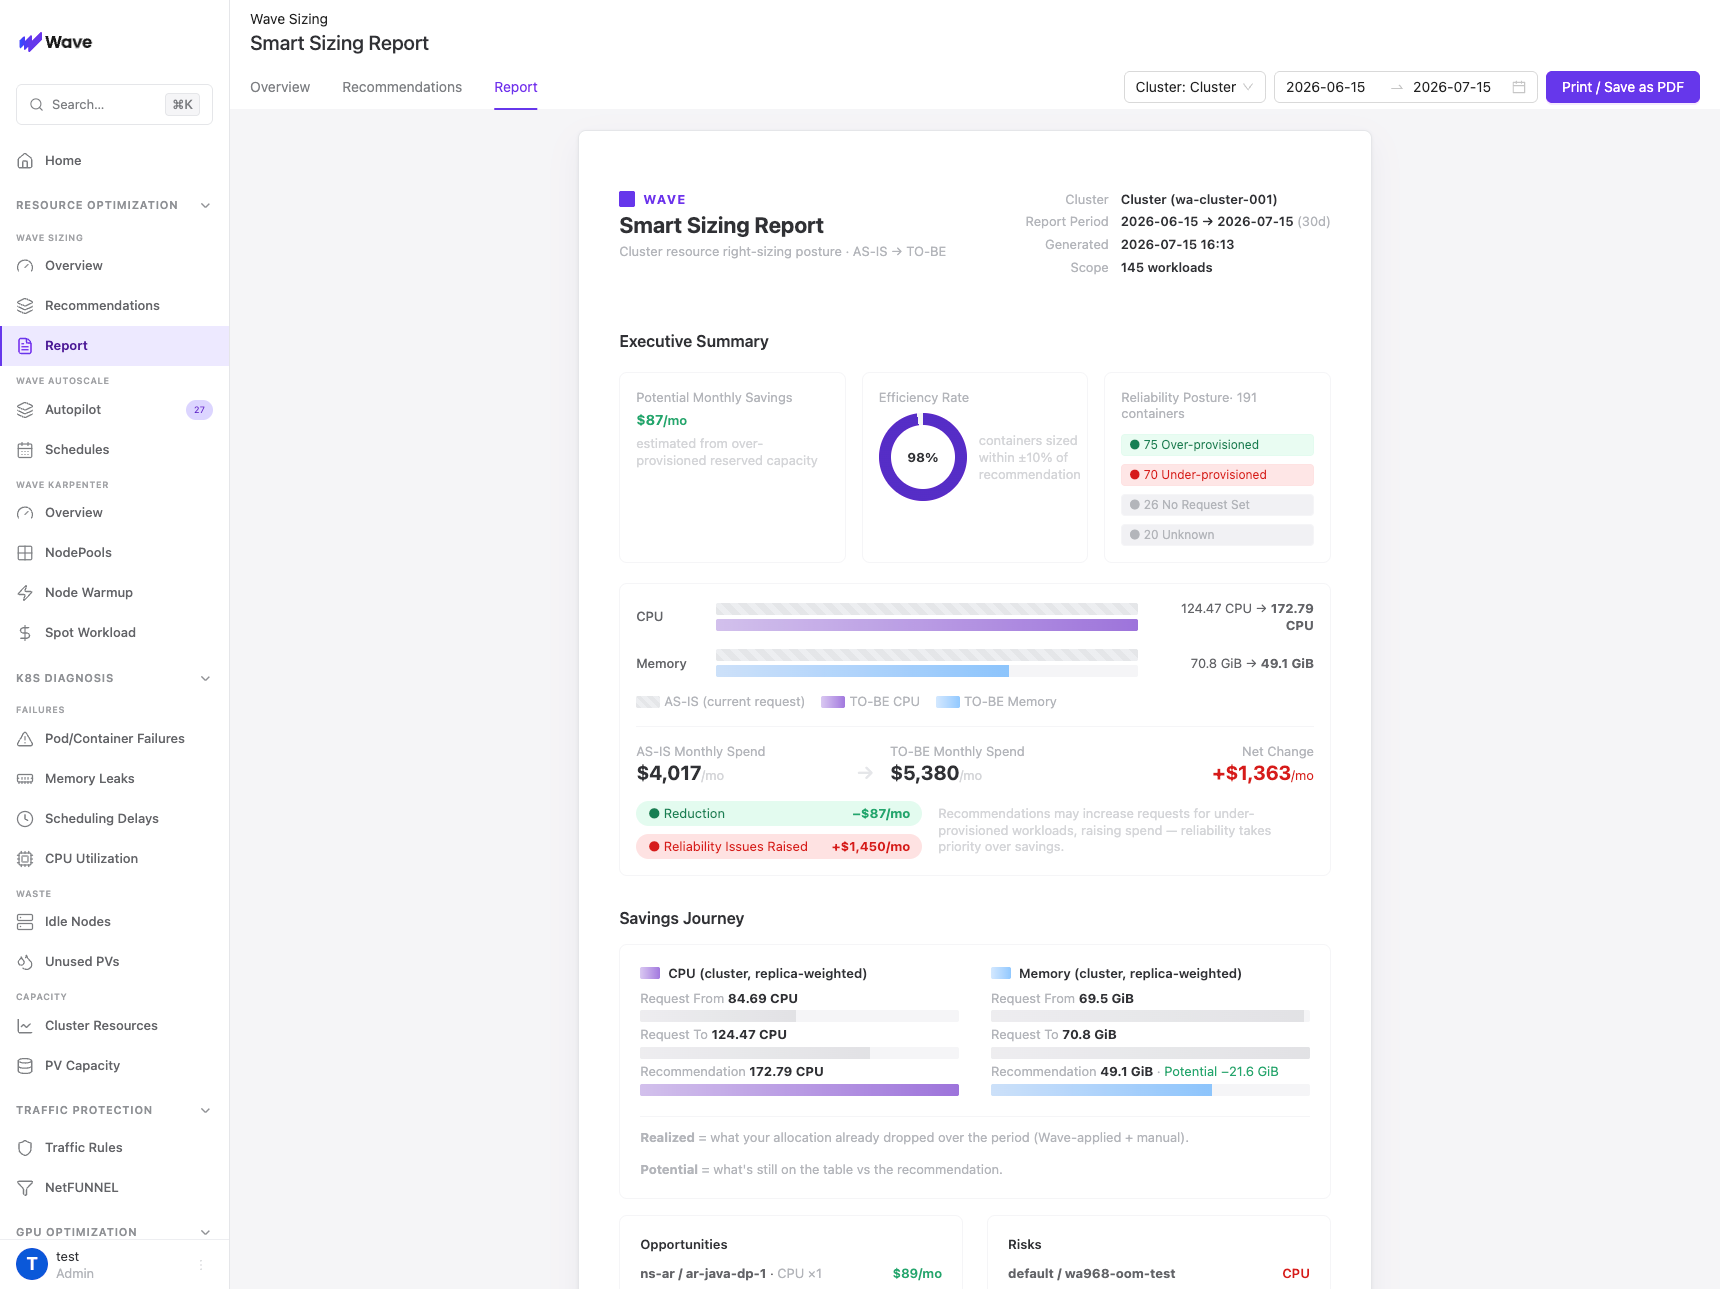
What's in the report
A report is generated per cluster over the Report Period (for example, the last 30 days) and covers the workloads in scope.
Executive Summary
- Potential Monthly Savings: an estimate of the monthly cost reducible by right-sizing over-provisioned reserved capacity.
- Efficiency Rate: the share of containers already sized within ±10% of their recommendation.
- Reliability Posture: a breakdown of all containers by state: Over-provisioned, Under-provisioned, Well-provisioned, No Request Set, and Unknown.
Resource comparison (AS-IS → TO-BE)
For CPU and memory, the report shows the current requested total (AS-IS) next to the recommended total (TO-BE), so the size of the change is obvious at a glance.
Monthly Spend
The AS-IS Monthly Spend and TO-BE Monthly Spend side by side, with the Net Change split into Reduction and any Reliability Issues Raised (cost added to bring under-provisioned workloads up to a safe value).
Savings Journey
For CPU and memory (cluster-wide, replica-weighted), the report traces Request From → Request To → Recommendation, separating what's already been Realized (allocation that dropped over the period, whether Wave-applied or manual) from what's still Potential versus the recommendation.
Opportunities & Risks
Opportunities ranks the workloads with the largest remaining savings so you know where to act first; Risks flags under-provisioned workloads that should be raised for reliability.
Workload detail
The Workloads view breaks the report down per workload: current requests, observed usage, recommended values, status, and estimated savings.
How to read it
Savings figures are estimates based on over-provisioned reserved capacity. They are guidance for prioritization, not a billing guarantee.
- Stability comes before savings. Under-provisioned workloads are recommended up, which can increase their cost; the report surfaces these as risk items rather than savings.
- The report reflects the recommendations Smart Sizing has computed; applying them is a separate, opt-in step (see Realtime Resizing and Resize Now).
Export & share
The report can be printed or saved as a PDF directly from the console for review, attaching to a change request, or sharing with stakeholders.