Cluster Resource Forecast
Running out of cluster CPU or memory is a problem you want to see coming weeks ahead, not at 3 a.m. Cluster Resource Forecast learns your cluster's consumption trend and projects CPU and memory utilization forward, with snapshot forecasts at 7 and 30 days, so you can plan node additions or right-size workloads with lead time instead of reacting to a capacity wall.
Open it under Wave Diagnosis in the sidebar, then Cluster Resources. Forecasting needs at least seven days of history; the cluster selector and date-range picker scope the view.
The forecast at a glance
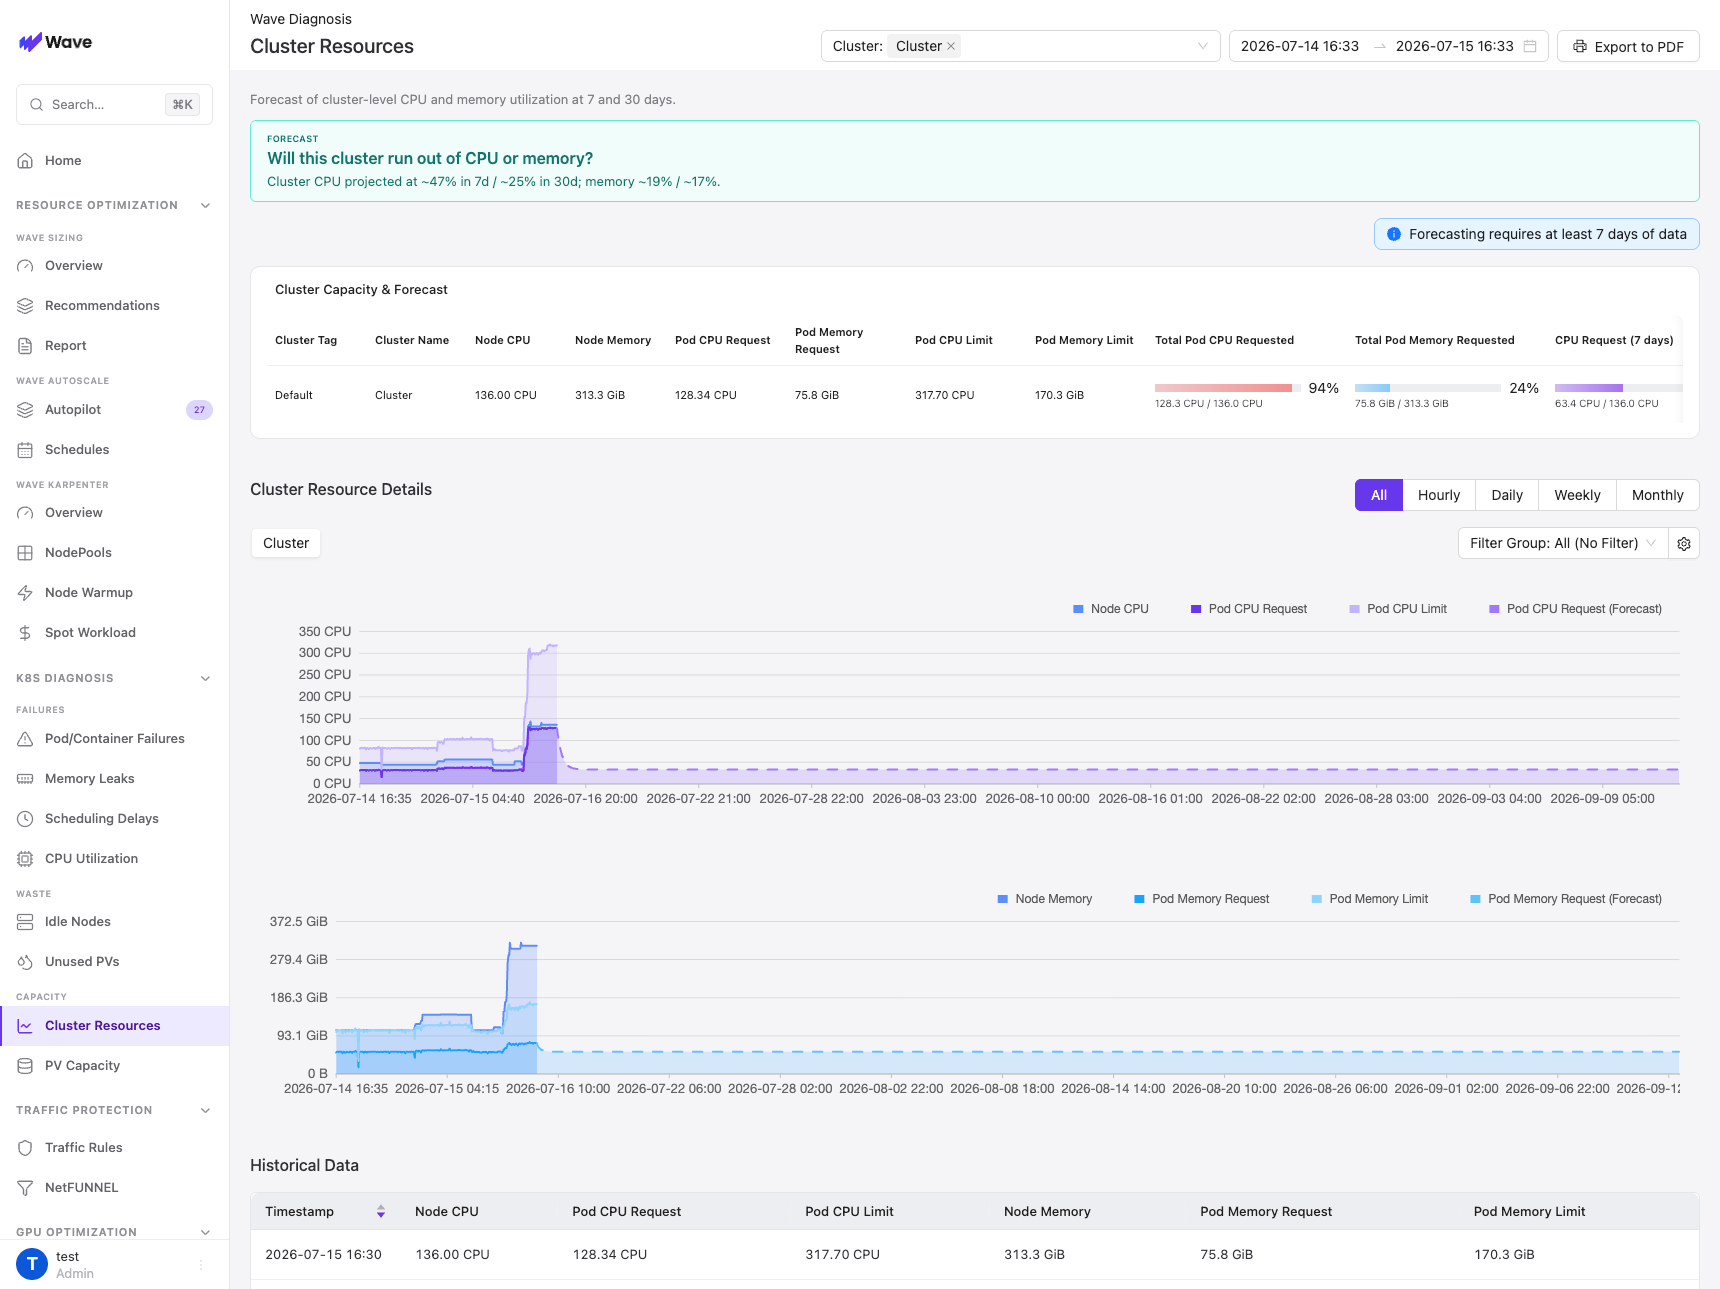
Forecast banner. A one-line answer to "Will this cluster run out of CPU or memory?", with projected CPU and memory utilization at 7 and 30 days.
Cluster Capacity & Forecast table. The numbers behind the banner: Node CPU and Node Memory (total capacity), the current Pod CPU / Memory Request and Pod CPU / Memory Limit, the Total Pod CPU / Memory Requested shown as a utilization bar (for example, 94% of node CPU already committed to requests), and the 7-day forecast column.
Resource Trend Charts
Cluster Resource Details plots the trend and its projection. Switch the time granularity (All, Hourly, Daily, Weekly, Monthly), and narrow the scope with Filter Group to forecast a subset of workloads rather than the whole cluster.
- CPU chart: Node CPU (capacity), Pod CPU Request, Pod CPU Limit, and Pod CPU Request (Forecast), which projects the request trend forward.
- Memory chart: Node Memory (capacity), Pod Memory Request, Pod Memory Limit, and Pod Memory Request (Forecast).
Read them by trend:
- Where a forecast line climbs toward the capacity line is roughly when you would run short.
- A steeper slope means faster consumption; a flat line means stable usage.
The Historical Data table below the charts lists the raw per-timestamp numbers (Node CPU, Pod CPU Request and Limit, and the memory equivalents) when you want to verify or export them.
You read the trend, not a countdown. Cluster Resource Forecast shows the projection and the 7 and 30 day snapshots; it does not print a single "days until exhaustion" number or fire an alert. You decide what "too close" means for your cluster by looking at the snapshot percentages and how fast the forecast line is rising, which keeps capacity decisions in your hands rather than on a fixed threshold.
Use Cases
Proactive capacity planning
Add nodes before the shortage lands. A 7 and 30 day view gives you time to get budget approved, raise a cloud quota, and schedule the change into a maintenance window, rather than scrambling when pods stop scheduling.
Infrastructure budget forecasting
Project cloud spend a month or two ahead. Use the forecast trend to justify a budget increase with data, align infrastructure cost with expected growth, and avoid the surprise bill that comes from emergency scaling.
What to Do Based on Forecast Trends
When a forecast trends toward capacity (high utilization bars, or a forecast line nearing the capacity line), pick the cheapest option that solves it:
- Add nodes when the growth is real. Size the addition from the forecast gap, then confirm the new capacity flattens the projection.
- Right-size over-provisioned workloads first when the cluster is wasteful. Apply Smart Sizing recommendations to cut inflated requests, and watch the forecast pressure drop without buying hardware.
- Trim inflated requests on specific services. Use Workload CPU Utilization to find workloads sitting well below their requests, and lower them.
- Put variable workloads on Autopilot. For services with swings in load, Autopilot scales replicas down in the quiet hours and frees capacity for everything else.
Related
- Wave Diagnosis Overview
- Smart Sizing: decide whether capacity pressure is growth or waste before adding nodes.
- Workload CPU Utilization: find the low-utilization workloads inflating cluster requests.
- Idle Node Detection: reclaim nodes that are already sitting idle.