Core Configuration
This page provides a complete reference of all Autopilot configuration settings. For detailed explanations of key features, see the linked guides.
Configuration Access
Configure Autopilot through the web console:
- Navigate to Deployments → Select your deployment
- Go to the Autopilot tab
- Click Edit to open the configuration modal
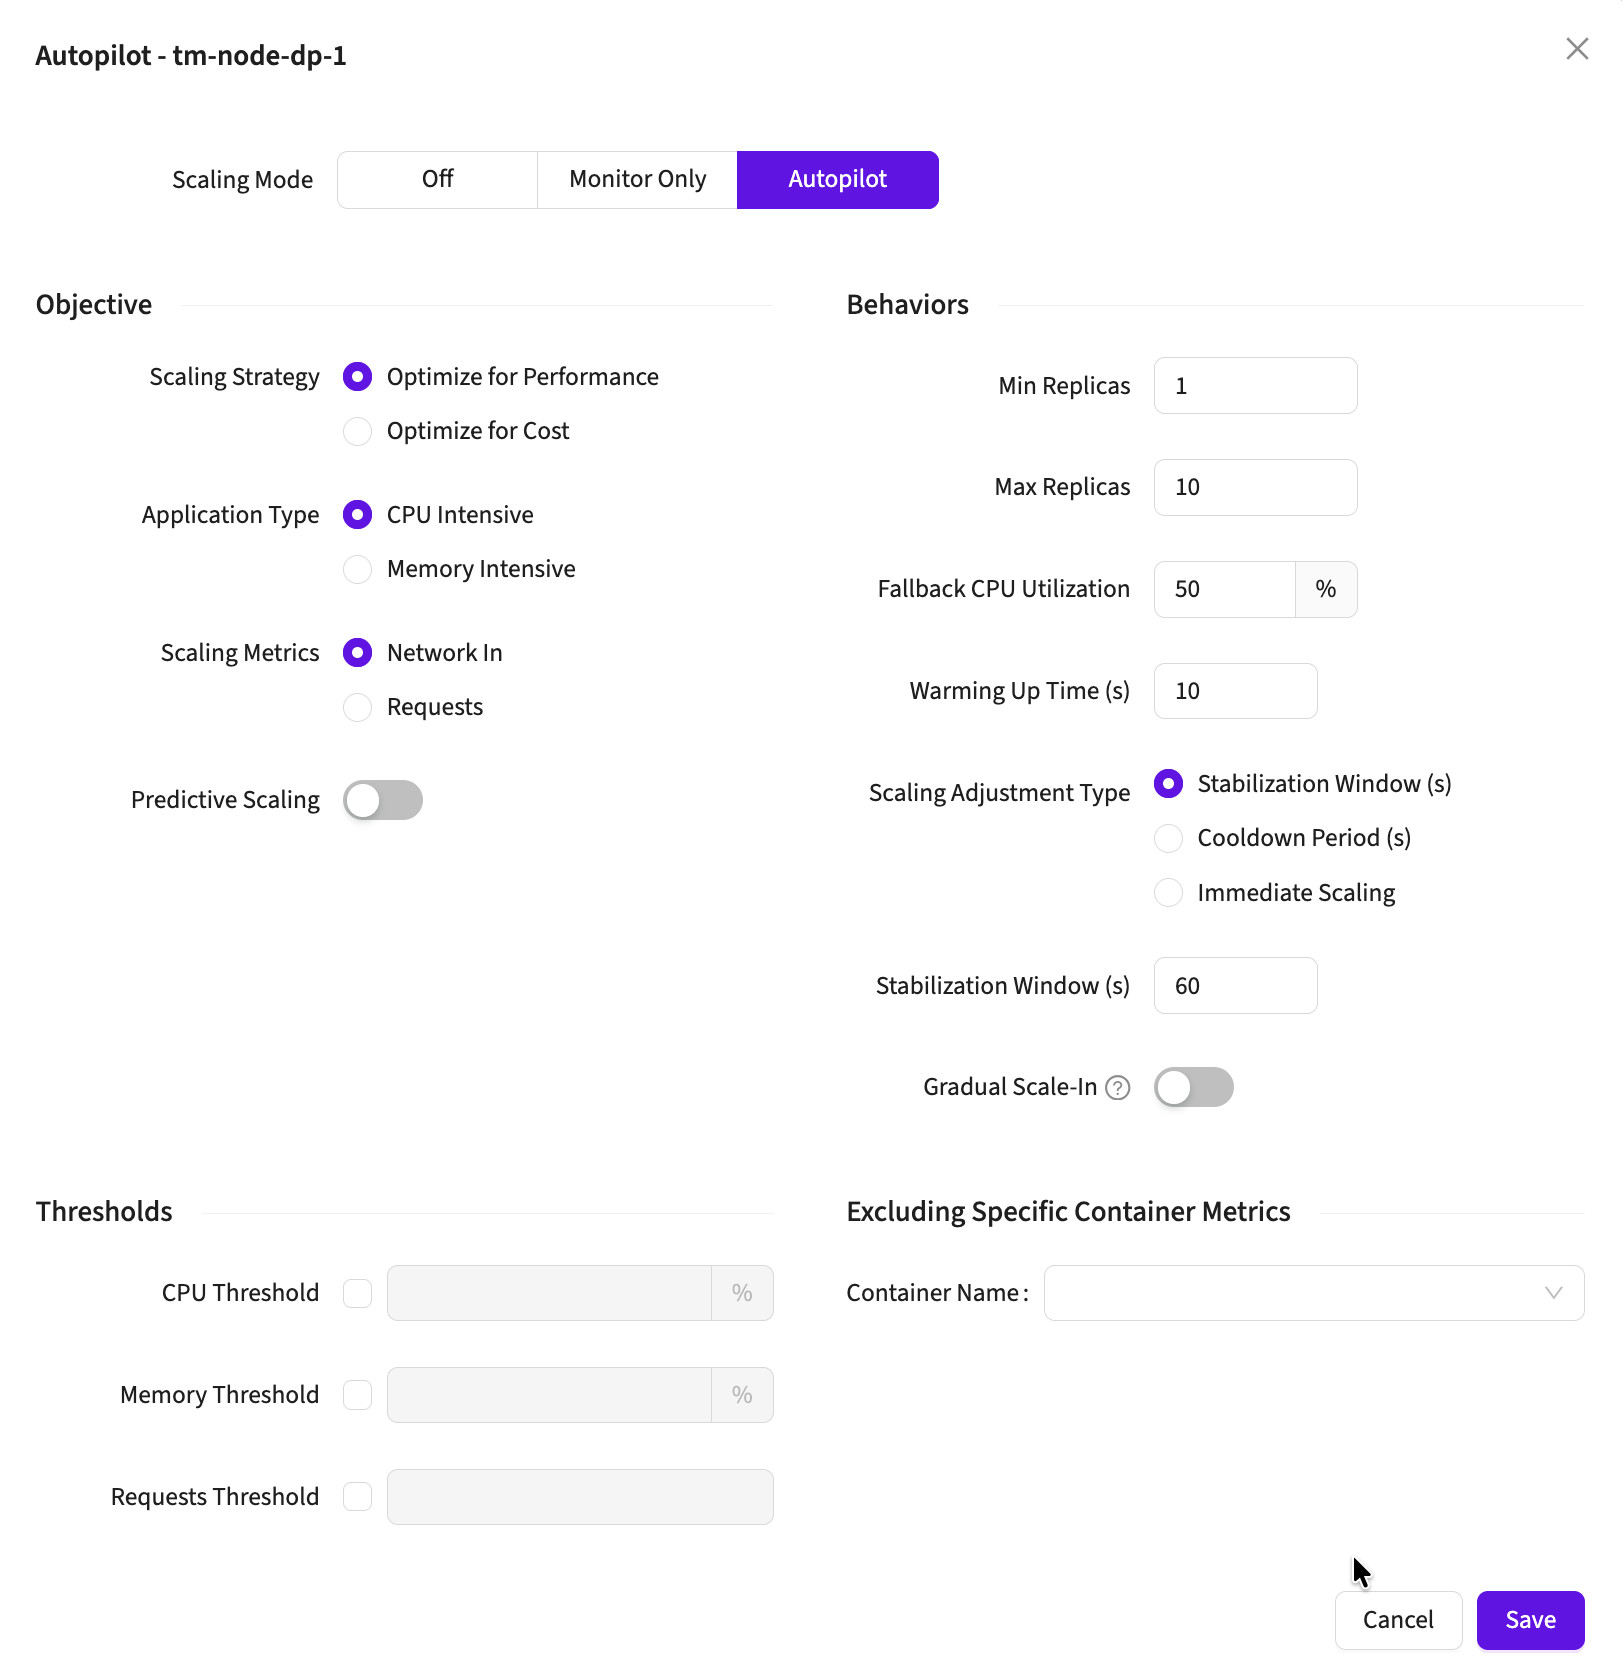
All Configuration Settings
The configuration modal is organized into sections:
Scaling Mode
Controls whether Autopilot applies scaling decisions:
| Mode | Description |
|---|---|
| Off | Autopilot completely disabled |
| Monitor Only | Predictions logged but not applied to cluster |
| Autopilot | Full automatic scaling enabled |
See: Getting Started for mode selection guide
Objective (Left Column)
Scaling Strategy
Choose optimization priority:
- Optimize for Performance: Conservative scaling, maintains headroom
- Optimize for Cost: Balanced scaling, minimizes excess capacity
See: Cost vs Performance Optimization for detailed comparison
Application Type
Workload resource profile:
- CPU Intensive: For compute-heavy workloads (web servers, APIs, processing)
- Memory Intensive: For memory-heavy workloads (caching, in-memory databases)
Affects which metrics are prioritized and fallback calculations.
CPU Utilization Basis
Wave 3.4.5+. Shown only when Application Type is CPU Intensive.
Chooses what "100% CPU" means for this workload:
- Request (default): utilization is measured against the container's CPU request. This matches HPA and is the right choice for most workloads.
- Limit: utilization is measured against the container's CPU limit.
Pick Limit when you deliberately set small requests so the scheduler packs pods densely, but you want scaling driven by how much CPU a pod is actually allowed to burn. With small requests, request-based utilization saturates early and triggers scale-out sooner than the pod's real headroom warrants; limit-based utilization tracks the headroom instead, so the same traffic typically converges on fewer replicas.
- A container with no CPU limit falls back to Request automatically.
- A container with neither a request nor a limit is not scaled, unchanged from earlier behavior.
- Switching a workload between Request and Limit invalidates its trained model. Wave re-trains under the new basis rather than reusing a model fitted to the other one, so expect a short warm-up after the change.
Fallback Only
Wave 3.4.5+.
Toggle that makes Autopilot skip the ML prediction step entirely and scale purely from the threshold-based fallback calculation. Every scaling event is then recorded with the Fallback apply type.
Use it when you want the fast reactive path without the model in the loop — for example while a new workload is still accumulating training data, or when you need scaling behavior that is fully explainable from the configured thresholds.
Scaling Metrics
Primary metric for load tracking:
- Network In: Scale based on incoming network traffic (bytes)
- Requests: Scale based on request count
Choose based on what best represents your workload's load.
Predictive Scaling
Toggle to enable time-series forecasting for proactive scaling. Off by default - Autopilot's normal behavior is reactive and fast, scaling from measured workload performance rather than forecasting demand.
See: Predictive Scaling for full guide
Behaviors (Right Column)
Min Replicas
Minimum number of pods to maintain at all times.
- Default: 1
- Recommended: Set based on baseline load and availability requirements
- Example: Set to 3 for high-availability services
Max Replicas
Maximum number of pods allowed.
- Default: 10
- Recommended: Set based on maximum expected load and cost limits
- Example: Set to 50 for highly variable traffic
Fallback CPU Utilization
Target CPU utilization percentage when ML predictions are unavailable.
- Default: 50%
- Range: above 0%. The old 100% ceiling was removed in Wave 3.4.5 — values over 100 are valid when you intend pods to run past their request or limit basis before scaling out.
- Measured against: the CPU Utilization Basis selected above (request by default, or limit).
- How it works: Uses HPA-style calculation:
desired_replicas = current_replicas * (current_cpu / target_cpu)
Fallback Memory Utilization
Target memory utilization percentage (only for Memory Intensive workloads).
- Default: 50%
- Range: 10-100%
- When used: Only applies when Application Type is "Memory Intensive"
Warming Up Time
Seconds to ignore metrics after deployment starts.
- Default: 10s
- Purpose: Prevents scaling decisions during pod initialization
- Recommended: Set to 30-60s for fast-starting apps, 120-300s for standard apps, 300-600s for JVM apps
See: Timing Controls for detailed explanation
Scaling Adjustment Type
Controls timing of scaling operations (choose one):
- Stabilization Window (s): Delays scale-in only - most common choice
- Input field for duration (default: 60s)
- Cooldown Period (s): Delays all scaling after any scaling event - rarely needed
- Input field for duration when selected
- Immediate Scaling: No delays - for predictable workloads
Gradual Scale-In
Separate toggle control for step-wise scale-down behavior:
- Toggle: Enable/Disable
- When enabled: Scales down 1 replica at a time instead of jumping to target
- Use for: Stateful services, connection draining, services where removing many pods at once causes disruption
See: Timing Controls for when to use each type
Thresholds (Bottom Left)
Emergency scale-down triggers when metrics drop below configured thresholds. Enable individually as needed:
CPU Threshold
- Toggle: Enable/Disable
- Value: Percentage (e.g., 10%)
- Behavior: When CPU drops below threshold, immediately scales to min_replicas
Memory Threshold
- Toggle: Enable/Disable
- Value: Percentage (e.g., 15%)
- Behavior: When memory drops below threshold, immediately scales to min_replicas
Requests Threshold
- Toggle: Enable/Disable
- Value: Request count (e.g., 100)
- Behavior: When requests drop below threshold, immediately scales to min_replicas
Purpose: Provides immediate cost savings when load disappears completely (e.g., traffic stops outside business hours).
Note: Threshold-based scaling bypasses normal cooldown periods but still respects Stabilization Window.
Excluding Specific Container Metrics (Bottom Right)
Container Name
List of container names to exclude from metrics collection.
- Use case: Sidecar containers (Istio proxy, logging agents) that shouldn't influence scaling
- Format: Tag input, enter container names
- Example:
istio-proxy,filebeat,fluentd
Configuration Examples
Example 1: High-Traffic Web API
Mode: Autopilot
Strategy: Optimize for Performance
Application Type: CPU Intensive
Scaling Metrics: Requests
Predictive Scaling: Enabled
Min Replicas: 5
Max Replicas: 30
Fallback CPU: 70%
Warming Up: 60s
Scaling Adjustment: Stabilization Window (120s)
Gradual Scale-In: Disabled
CPU Threshold: Enabled (10%)Why: User-facing service needs fast response, maintains capacity buffer
Example 2: Cost-Optimized Background Worker
Mode: Autopilot
Strategy: Optimize for Cost
Application Type: CPU Intensive
Scaling Metrics: Network In
Predictive Scaling: Disabled
Min Replicas: 1
Max Replicas: 20
Fallback CPU: 80%
Warming Up: 30s
Scaling Adjustment: Immediate Scaling
Gradual Scale-In: Disabled
Thresholds: NoneWhy: Background processing, cost matters more than latency
Example 3: Business Hours Service
Mode: Autopilot
Strategy: Optimize for Performance
Application Type: Memory Intensive
Scaling Metrics: Requests
Predictive Scaling: Enabled
Min Replicas: 3
Max Replicas: 25
Fallback CPU: 65%
Fallback Memory: 70%
Warming Up: 120s
Scaling Adjustment: Stabilization Window (180s)
Gradual Scale-In: Enabled
Memory Threshold: Enabled (15%)Why: Memory-heavy service with predictable business hours pattern
Configuration Best Practices
Initial Setup
- Start conservative: Higher Min Replicas, longer Stabilization Window
- Enable Monitor Mode first: Observe predictions for 24-48 hours
- Adjust gradually: Change one setting at a time
- Monitor closely: Watch Autopilot logs after changes
Production Deployment
- Set appropriate Min/Max: Based on historical traffic data
- Enable Predictive Scaling: If traffic has daily/weekly patterns
- Use Stabilization Window: For most workloads (not Immediate)
- Configure thresholds: For services with clear off-peak periods
- Document decisions: Record why settings were chosen
Common Patterns
Pattern 1: Steady Traffic
- Immediate Scaling or short Stabilization Window (60s)
- Moderate Min/Max range
- Predictive Scaling: Optional
Pattern 2: Variable Traffic
- Stabilization Window (120-180s)
- Wider Min/Max range
- Predictive Scaling: Enabled
Pattern 3: Business Hours Only
- Stabilization Window with thresholds
- Enable CPU/Memory Thresholds
- Combine with Autopilot Scheduler
Validation and Testing
Before Enabling
- Verify deployment has CPU and Memory requests defined
- Confirm no active HPA (or disable it)
- Check WA Metrics Agent is collecting data
- Review historical metrics to set Min/Max appropriately
After Enabling
- Monitor for 24 hours in Monitor Mode
- Review Autopilot logs for prediction accuracy
- Check for any errors or warnings
- Switch to Autopilot mode when confident
Testing Changes
- Make changes during low-traffic periods
- Monitor Autopilot logs after change
- Compare metrics before/after
- Rollback if unexpected behavior occurs
Troubleshooting
Configuration Won't Save?
- Min Replicas ≤ Max Replicas
- Fallback utilization values between 10-100%
- All required fields filled
Autopilot Not Scaling?
- Mode is "Autopilot" (not "Monitor Only")
- Review logs for
is_affected: falseentries - Verify metrics are being collected
- Check if in cooldown/stabilization window
Unexpected Scaling?
- Review threshold settings (may trigger emergency scale-down)
- Check Predictive Scaling predictions
- Verify fallback utilization targets
- Review Scaling Adjustment Type setting
Related Documentation
- Getting Started: Initial Autopilot setup
- Cost vs Performance: Strategy selection guide
- Predictive Scaling: Forecasting configuration
- Timing Controls: Scaling adjustment types and warming up time
- Autopilot Scheduler: Time-based configuration changes
- Min/Max Recommendations: Choose between minimum and maximum recommendation values
Configuration API
For programmatic configuration, see the API documentation (coming soon) or use the web console export feature to generate configuration files.