Autopilot Overview
Autopilot is Wave Autoscale's intelligent horizontal pod autoscaling solution that dynamically adjusts the number of pod replicas in response to real-time workload demands. Unlike traditional Horizontal Pod Autoscaler (HPA), Autopilot uses machine learning to learn individual workload patterns and responds to scaling events.
What is Autopilot?
Autopilot is an ML-driven horizontal scaling system that automatically manages pod replica counts based on real-time metrics and workload patterns. It replaces manual HPA configuration with autonomous scaling decisions that adapt to your application's unique behavior.
How Autopilot Works
Autopilot continuously evaluates each workload and combines real-time metrics with machine learning to make smart scaling decisions:
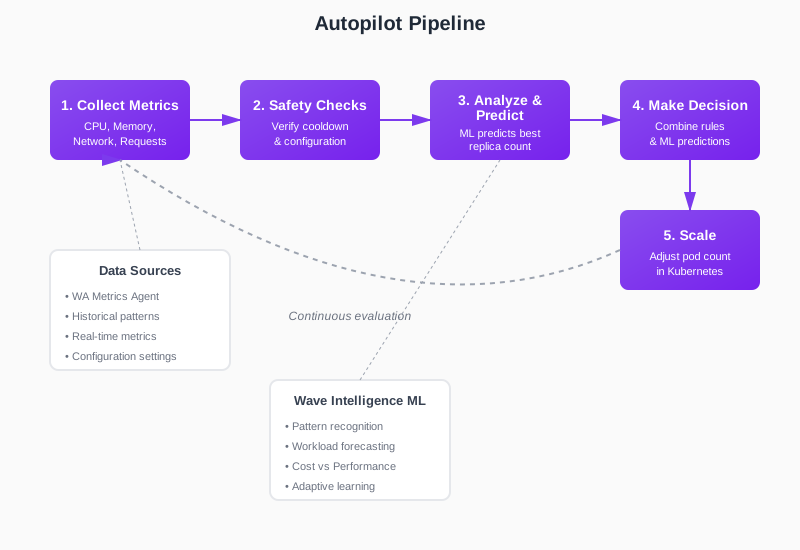
- Collect Metrics: Gathers current CPU, memory, network, and request data, ensuring it's recent and accurate
- Safety Checks: Waits for cooldown periods to complete and verifies settings to prevent rapid back-and-forth scaling
- Analyze & Predict: Checks if metrics exceed thresholds while the ML service predicts the best replica count based on historical patterns, current metrics, and your optimization mode (Performance vs Cost)
- Make Decision: Combines rule-based logic with ML predictions, with fallback calculations for safety
- Scale: Adjusts the number of pods in your Kubernetes cluster
Autopilot vs Traditional HPA
| Feature | Traditional HPA | Autopilot |
|---|---|---|
| Response Time | 30 seconds - 5 minutes | < 10 seconds |
| Configuration | Manual threshold tuning per service | Workload behaviour based learning |
| Metrics | Basic CPU/Memory | Network, Requests, PSI |
| Scaling Approach | Reactive to current load | Performance model based |
| Adaptation | Static thresholds | Continuously learning |
| Over/Under Provisioning | Common due to conservative margins | Minimized through pattern learning |
Core Features
1. Strategy-Based Optimization
Autopilot provides two optimization strategies:
Performance: Conservative scaling optimized for maximum responsiveness
- Rounds up replica calculations to ensure sufficient capacity
- Higher CPU/memory target thresholds (90% CPU, 95% memory)
- Prioritizes availability over cost
Cost: Balanced scaling optimized for resource efficiency
- Rounds replica calculations normally
- Lower CPU/memory target thresholds (70% CPU, 85% memory)
- Balances performance with cost savings
2. ML-Driven Scaling (Autopilot ML Model)
Uses the Autopilot ML model that learns the relationship between workload load and performance:
- Training: Analyzes historical metrics (default: 14 days) to build workload-specific models
- Prediction: Predicts optimal replica count based on:
- Current load (network traffic or request count)
- Performance metrics (CPU usage, memory usage, latency)
- Target performance thresholds from strategy
- Resource requests (CPU cores, memory)
- Fallback: Falls back to HPA-style utilization-based scaling when ML model unavailable
3. Predictive Scaling with Forecasting
Proactive scaling using time-series forecasting:
- Forecast Horizon: Looks ahead (configurable minutes) to predict future load
- Load Forecasting: Uses statistical models to forecast load metrics
- Early Scaling: Scales up before traffic arrives to prevent latency spikes
4. Timing Controls
Fine-grained control over scaling behavior:
- Cooldown Period: Prevents rapid successive scaling actions (default configurable per workload)
- Stabilization Window: Additional delay before scaling down to prevent flapping
- Ignore Initial Metrics: Skips metrics during workload startup phase
- Gradual Scaling: Implements gradual scale-in protection. After a scaling action, prevents rapid scale-in for the configured duration.
5. Core Configuration
Comprehensive per-workload settings:
Application Type Profiles:
- CPU Intensive: Optimizes for CPU-bound workloads
- Memory Intensive: Optimizes for memory-bound workloads
Load Tracking:
- Network In: Scales based on incoming network traffic
- Requests: Scales based on request count
- Custom PromQL: Scales based on custom Prometheus queries
Threshold Configuration:
- CPU percentage threshold
- Memory percentage threshold
- Request count threshold
Resource Boundaries:
- Min replicas (lower bound)
- Max replicas (upper bound)
- Fallback CPU utilization target
- Fallback memory utilization target
Performance Objectives:
- Latency targets (optional)
- Forecast horizon for predictive scaling
6. Autopilot Scheduler
Time-based configuration management:
Schedule Types:
- Period: Recurring schedules with day-of-week selection (Sun-Sat)
- Once: One-time schedule execution
Features:
- Multiple Configurations: Apply different autopilot configs at different times (e.g., aggressive scaling during business hours, conservative at night)
- Config Swapping: Automatically switches between different strategy/threshold combinations based on schedule
7. Operating Modes
Two flags control autopilot behavior:
- Monitoring: When enabled, autopilot runs the full pipeline
- Autopilot Enabled: When enabled with simulation mode, actually applies scaling decisions
| Monitoring | Autopilot Enabled | Behavior |
|---|---|---|
| ✅ true | ✅ true | Full Autopilot - Makes predictions and applies scaling |
| ✅ true | ❌ false | Monitoring Only - Makes predictions but doesn't scale |
| ❌ false | (any) | Disabled - No processing |

This allows safe testing (monitoring mode) before enabling full autopilot.
Integration with Other Wave Features
Autopilot works seamlessly with:
- Smart Sizing: Vertical optimization complements horizontal scaling
- Autopilot Scheduler: Time-based policies for predictable scaling events
Learn More
- Getting Started with Autopilot - Step-by-step setup guide
- Cost vs Performance Optimization - Choosing the right optimization mode
- Predictive Scaling - Leveraging historical patterns
- Timing Controls - Fine-tuning scaling behavior
- Core Configuration - Advanced configuration options
- Autopilot Scheduler - Time-based scaling management