Smart Sizing Tab in Workload
Every workload detail page (Deployments, StatefulSets, DaemonSets, and the other supported kinds) has a Smart Sizing tab. This is where you review recommendations for one workload and act on them.
Which mode is active
The tab label tells you which recommendation model the workload uses:
| Tab label | Model | Apply paths |
|---|---|---|
| Smart Sizing | Usage-based model (7+ days of observed usage) | Resize Now + Realtime Resizing |
| Smart Sizing with HPA | Workload performance model | Resize Now (manual) only |
| Smart Sizing with Autopilot | Workload performance model | Resize Now (manual) only |
For HPA and Autopilot workloads, the performance model recommends one CPU/memory value that stays valid while the replica count changes. It needs at least 5 data points at distinct replica counts; until then the chart shows no recommendation. Why Realtime Resizing is unavailable here.
One exception: Autopilot in Monitoring Mode does not scale the workload, so Realtime Resizing stays available there. The Resize-Now-only restriction applies only once Autopilot or HPA is actively scaling the workload.
Page anatomy
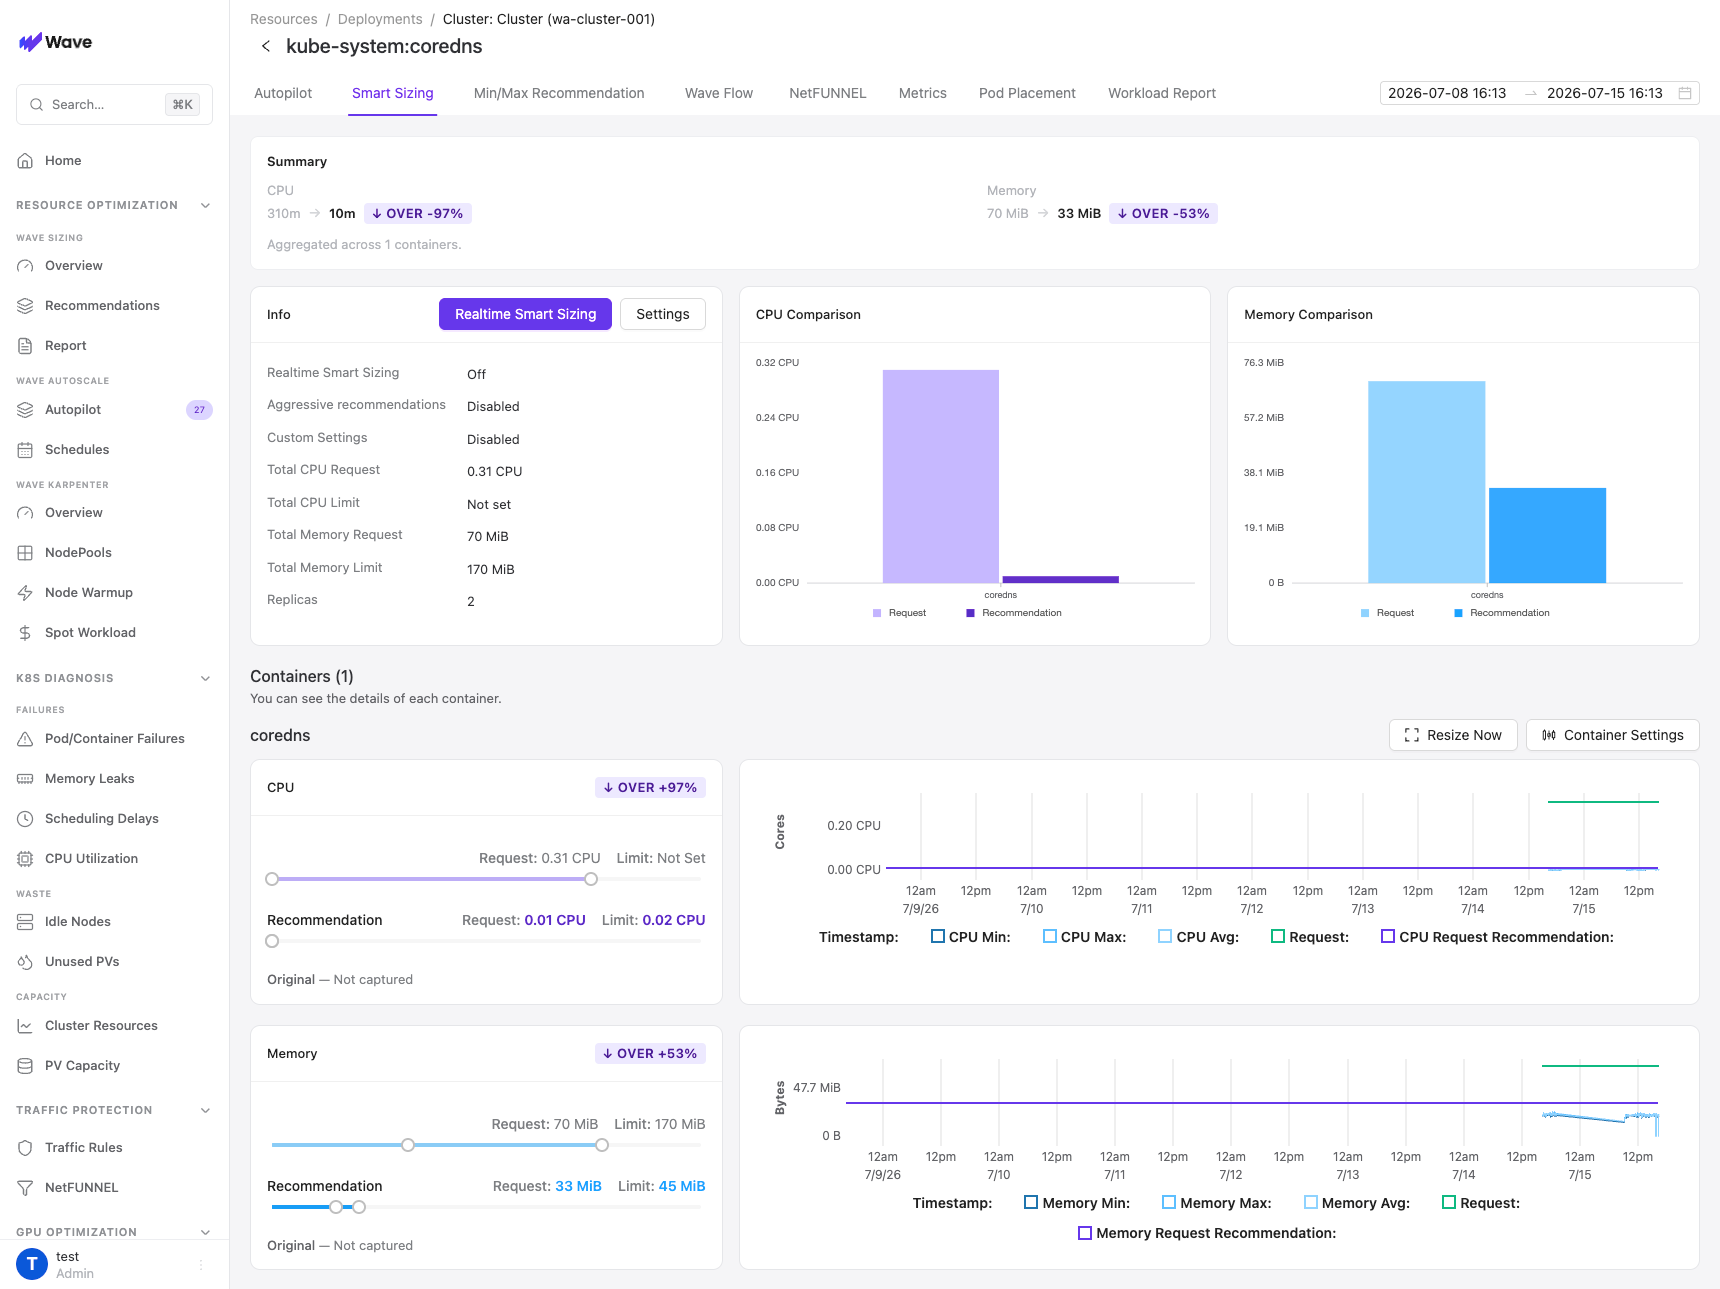
Summary
Aggregated current → recommended CPU and memory across all containers, with the same OVER/UNDER/OK badges as the Recommendations page.
Info card
Shows the workload's sizing state at a glance:
- Realtime Resizing: the current apply mode (Off, In-place, or Manifest) and, when active, how many containers have auto-apply enabled.
- Custom Settings: whether any container has custom recommendation bounds enabled.
- Total CPU/Memory Request and Limit, and Replicas.
Two buttons sit on the card (usage-based mode only):
- Realtime Resizing: opens the apply-mode modal. See Realtime Resizing.
- Settings: workload-level options, currently the Aggressive Recommendations toggle.
CPU / Memory Comparison
Bar charts comparing each container's current request against its recommendation, a quick visual of which containers drift the most.
Container cards
Each container gets a CPU card and a memory card:
- Current request/limit sliders and the Recommendation request/limit below them.
- Original: the request/limit values captured before Wave's first resize of this container. Shows Not captured until Wave applies its first change.
- A usage time-series chart with min/max/avg usage, the current request, and the recommendation overlaid.
- A recommendation log table listing the values produced by each 10-minute analysis cycle.
Per-container buttons:
| Button | What it does |
|---|---|
| Resize Now | Apply the recommendation on demand; see Resize Now |
| Container Settings | Recommendation bounds and auto-apply for this container; see Container Settings |
| Restore Original | Revert the container to its captured original values (appears after the first Wave-applied change) |
Restore Original
The first time Wave changes a container's resources (via Resize Now or a Realtime apply), it captures the container's request/limit values once. Restore Original patches the workload definition back to those values, including re-clearing fields that were originally unset.
Restore updates the workload definition. In Manifest mode that triggers a normal rollout, so running pods pick up the restored values. If the workload was resized in-place, running pods keep their current values until the next rollout; trigger one manually if you need the restore to take effect immediately.
Apply History
When Realtime Resizing is active, every apply attempt is logged in the collapsible Apply history panel: time, mode (in-place / manifest), container, old → new request and limit, the result, and a reason when an apply failed.
Recommendations skipped by the change thresholds don't appear here. No API call was made.
CRD mode
When Wave runs in CRD mode (GitOps), the console is read-only for configuration: the Realtime Resizing, Settings, Container Settings, and Restore Original buttons are disabled with a "Managed by CRD" tooltip. Edit the corresponding WaveSmartSizingPolicy CR instead.