Aggressive Recommendations
Default Smart Sizing has two objectives, in this order: keep the workload reliable first, and make it cost-effective second. That is why it analyzes 7+ days of usage and other SLI metrics: even when a workload idles far below its peak for long stretches, the recommendation stays high enough to survive the busiest period. The recommendation can therefore look high compared to idle-state usage; that gap is the reliability objective at work, not an error.
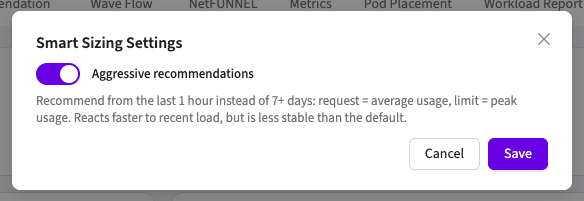
Some teams put cost first. Aggressive Recommendations flips that priority: it analyzes only the last 1 hour of CPU and memory data and recommends from that:
- Request = average usage over the last hour
- Limit = peak usage over the last hour
Your Container Settings buffer and min/max bounds still apply on top of the aggressive values.
Default vs Aggressive
The default recommendation drifts only slowly as the multi-day pattern changes, staying near the long-term peak so the workload survives its busiest hour. The aggressive recommendation tracks recent usage: total requests across the cluster follow the actual usage curve much more closely, which is where the extra savings come from.
Turning it on
On the workload's Smart Sizing tab, click Settings on the Info card and enable Aggressive recommendations. The setting is per workload.
Combined with Realtime Resizing, requests keep tracking usage automatically every 10-minute cycle. Two limits also relax in aggressive mode so it can follow the curve closely:
- Lower recommendation floor: CPU recommendations can go down to 0.01 core, instead of the standard 0.1 core floor. The memory floor stays at 12 MiB, the container runtime's minimum.
- Lighter skip thresholds: the priority-ratio check is disabled, and a change is applied from 10 mCPU or 10 MiB (instead of 50 mCPU / 64 MiB).
When to use it, and when not to
| Good fit | Poor fit |
|---|---|
| Cost reduction is the primary objective | Reliability-critical workloads that must absorb sudden spikes |
| Steady, predictable load curves | Bursty or spiky traffic, the 1-hour window forgets the last spike quickly |
| Dev / staging environments | Apps that need high resources at startup (e.g. JVM warm-up): a quiet hour produces a recommendation too small to boot comfortably |
| Workloads where a brief throttle is acceptable | Workloads where an OOMKill is an incident |
We don't recommend applying Aggressive Recommendations to all workloads. It reacts faster to recent load but is inherently less stable than the default 7+ day analysis. Keep a protective buffer and minimum bounds on workloads that need them.
Recommended pattern for HPA / Autopilot workloads
HPA and Autopilot workloads can't use Realtime Resizing, but Aggressive Recommendations gives you a clean way to find their per-pod baseline:
- With HPA / Autopilot off, enable Aggressive Recommendations and observe the minimum recommended request/limit.
- Set the CPU and memory request (and limit if needed) manually from that baseline.
- Turn HPA or Autopilot back on and let it scale the number of pods for traffic.
Vertical sizing comes from Smart Sizing once; horizontal scaling handles the load dynamics, instead of running realtime resizing and an autoscaler against the same workload at the same time.