PV Capacity Forecast
PV Capacity Forecast predicts when your Persistent Volumes will run out of space, preventing data loss and application crashes from storage exhaustion with 7-60 days advance warning.
What is PV Capacity Forecast?
PV Capacity Forecast continuously monitors PV usage patterns and growth rates to predict when individual Persistent Volumes will reach capacity limits. By analyzing historical consumption trends and applying machine learning-based forecasting, it provides early warnings so you can expand storage proactively before critical failures occur.
How It Works
PV Capacity Forecast follows this analysis pipeline:
- Metrics Collection: Queries PV usage data for each Persistent Volume (used bytes, available bytes, capacity)
- Growth Analysis: Calculates consumption trends per PV over time (minimum 7 days historical data required)
- ML Forecasting: Applies Seasonal Exponential Smoothing and other time-series models via Wave Intelligence Server to project usage 7-60 days ahead
- Forecast Visualization: Displays historical data (solid lines) and forecast projections (dashed lines) on charts for visual trend analysis
- Snapshot Predictions: Provides specific usage predictions at day 7 and day 30 as color-coded progress bars
- Log Storage: Stores forecast results for historical tracking and trend analysis
Technical Implementation
PV Capacity Forecast integrates with the Wave Intelligence Server for ML-based forecasting. The system processes PV metrics through a multi-model ensemble approach:
- File:
core/services/src/tasks/pv_capacity_forecast/task.rs - Models: SeasonalExponentialSmoothingOptimized and other time-series algorithms
- Forecast Horizon: 7-60 days
- Update Frequency: Daily
- Minimum Data: 7 days of historical metrics
- Timeout: Configurable via
WAEnv::get_intelligence_server_forecast_pv_capacity_timeout_secs()
The system calculates used_bytes if not provided by the storage backend, ensuring accurate forecasts across different storage classes.
Prerequisites
Minimum Data Requirement
PV Capacity Forecast requires at least 7 days of historical metrics after PV creation before forecasts can be generated. New PVs will show "Insufficient Data" or "N/A" until enough historical data is collected.
- Minimum: 7 days of metrics
- Recommended: 14+ days for more accurate predictions
- Metric Collection: Automatic via Wave Metrics Agent
Key Features
- 7-60 Day Forecast Window: Sufficient time for capacity planning, budget approval, and expansion scheduling
- Per-PV Analysis: Individual forecasts for each volume ensure no storage is overlooked
- Growth Pattern Recognition: Detects both steady growth and seasonal patterns (e.g., log volume spikes during business hours)
- Auto Expansion Integration: Triggers PV Auto Expansion automatically when enabled
- Historical Tracking: Stores forecast history to validate prediction accuracy and improve models over time
Understanding the Forecast View

PV Usage Rate & Forecast Table
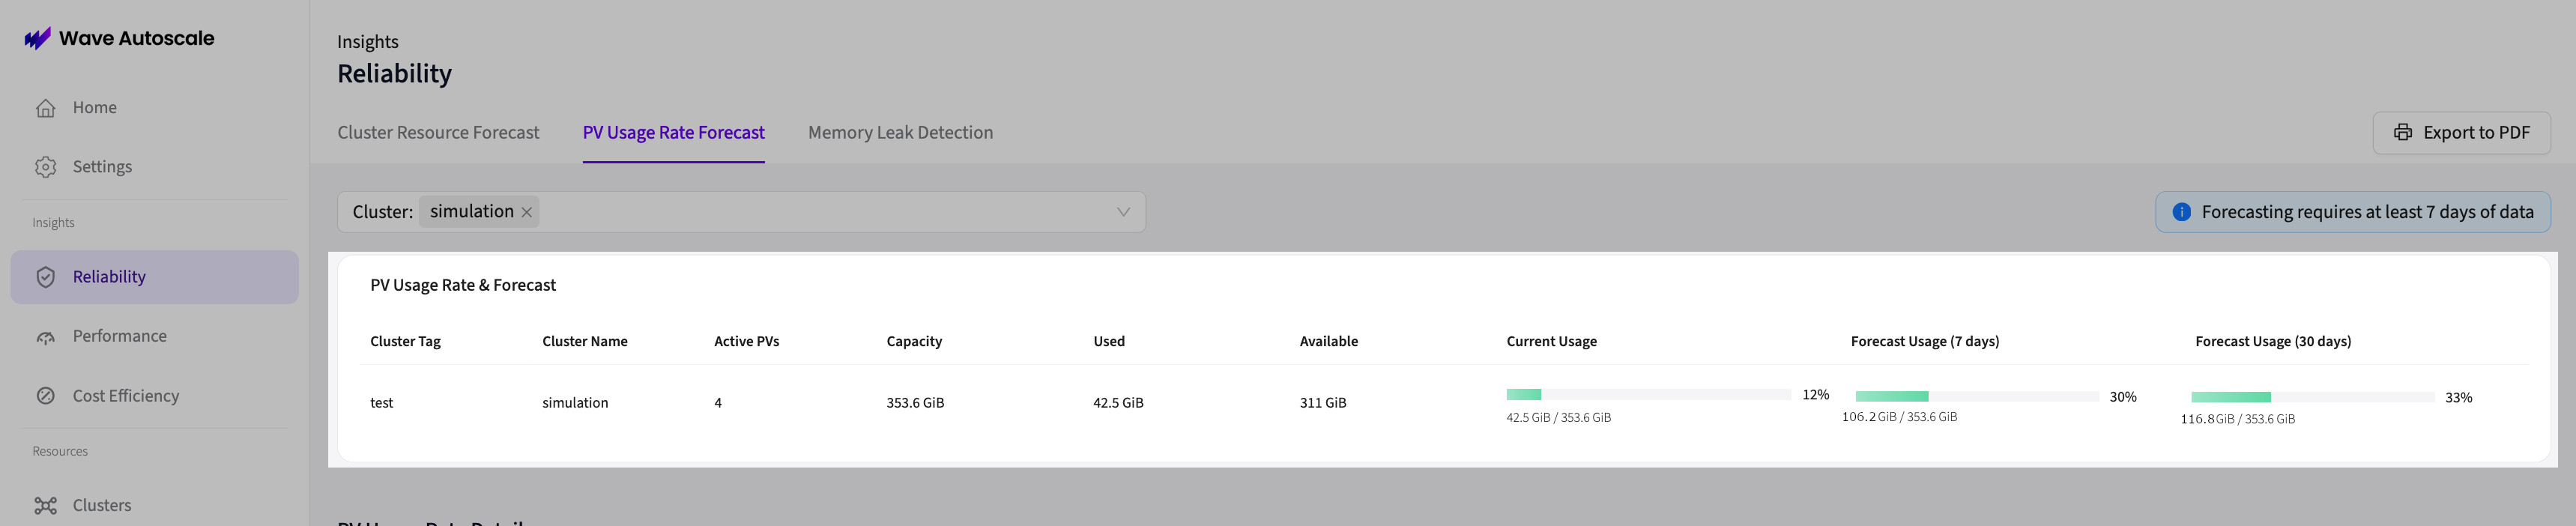
Displays cluster-level aggregated metrics across all PVs:
Current Metrics:
- Active PVs: Number of Persistent Volumes being monitored (PVs bound to pods with active metrics collection)
- Capacity: Total storage capacity across all PVs in the cluster
- Used: Total consumed storage across all PVs
- Available: Total free storage across all PVs
- Current Usage: Progress bar showing used/capacity percentage
Forecast Snapshots:
- Forecast Usage (7 days): Predicted total usage at day 7 shown as a progress bar
- Forecast Usage (30 days): Predicted total usage at day 30 shown as a progress bar
Progress bars use color-coded thresholds:
- Indigo/Purple: Healthy capacity headroom (< 80% of total capacity)
- Yellow/Amber: Approaching capacity limits (80-89% of total capacity)
- Red: Capacity constraints predicted (≥ 90% of total capacity)
PV List & Details
The interface uses a master-detail layout where the left side shows a list of all PVs, and the right side shows detailed forecast data for the selected PV.
PV List Table
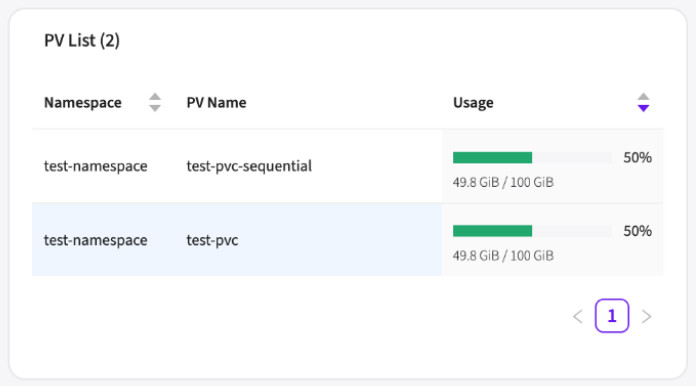
Shows all Persistent Volumes in the selected cluster:
- Namespace: Kubernetes namespace containing the PVC
- PVC Name: PersistentVolumeClaim name
- Usage: Progress bar showing current used/capacity percentage
Interaction: Click any PV row to view detailed forecast on the right side. The selected row is highlighted with a blue background.
Sorting: The table is sorted by usage percentage (highest to lowest) by default to quickly identify PVs nearing capacity.
Use Cases
Prevent Database Crashes
Databases are particularly sensitive to storage exhaustion. When a database runs out of disk space:
- Write operations fail, causing application errors
- Database becomes read-only, breaking write functionality
- Transactions are rolled back, losing user data
- Recovery requires manual intervention and downtime
PV Capacity Forecast prevents these failures by expanding storage before write failures occur.
Manage Log Storage Growth
Application logs, system logs, and audit logs grow continuously. Without forecasting:
- Log pipelines stop when buffers fill
- Debugging becomes impossible without recent logs
- Compliance requirements are violated if audit logs are lost
- Log rotation alone doesn't solve growth problems
PV Capacity Forecast identifies when log volume growth will exhaust storage, enabling proactive expansion or archival.
Plan Storage Budget
Storage costs can surprise finance teams without visibility into growth trends:
- Predict quarterly storage spending based on historical growth
- Justify budget increases with data-driven forecasts
- Avoid emergency expansions that disrupt budgets
- Optimize storage tiers (hot/warm/cold) based on growth patterns
Support Data-Intensive Workloads
AI/ML training, data analytics, and media processing workloads consume storage rapidly:
- Model training generates checkpoints and artifacts that fill volumes quickly
- Analytics jobs write intermediate results that accumulate over time
- Media processing creates temporary files that may not be cleaned up
- PV Capacity Forecast ensures these workloads never run out of space mid-job
What to Do When Forecast Shows Storage Risk
When PV Capacity Forecast predicts storage exhaustion, consider these options:
Option 1: Enable PV Auto Expansion (Automatic Solution)
Best for: Production workloads requiring zero-downtime expansion
Steps:
- Navigate to PV Auto Expansion configuration
- Enable auto-expansion for the target PVC/StatefulSet
- Configure expansion threshold (recommended: 70-80% capacity)
- Set maximum size limit to prevent runaway growth
- Verify expansion triggers automatically when threshold is reached
Pros: Fully automatic, zero-downtime, prevents emergencies Cons: Requires Kubernetes 1.27+ for online expansion
See PV Auto Expansion documentation for detailed setup instructions.
Option 2: Manually Expand PVC Size
Best for: One-time expansion or clusters without auto-expansion support
Steps:
- Verify storage class supports volume expansion (
allowVolumeExpansion: true) - Edit PVC spec to increase
resources.requests.storage - Wait for storage backend to complete expansion
- Verify new capacity is reflected in PV Capacity Forecast
Example:
kubectl patch pvc database-pvc -p '{"spec":{"resources":{"requests":{"storage":"200Gi"}}}}'Pros: Simple for one-time needs, works on older Kubernetes Cons: Requires manual intervention, potential downtime depending on storage backend
Option 3: Clean Up Old Data or Logs
Best for: Volumes with accumulated temporary or archival data
Steps:
- Identify files that can be safely deleted (old logs, temp files, expired data)
- Implement log rotation policies to automatically clean up old logs
- Archive data to cold storage (S3, GCS, Azure Blob) before deleting
- Schedule periodic cleanup jobs to prevent re-accumulation
Pros: Reduces storage costs, extends capacity without expansion Cons: Requires understanding of data lifecycle, may lose historical data if not archived
Option 4: Archive Data to Cold Storage
Best for: Long-term data retention without hot storage costs
Steps:
- Set up cold storage bucket (S3 Glacier, GCS Archive, Azure Archive)
- Identify data older than retention threshold (e.g., 90 days)
- Copy data to cold storage using backup tools (Velero, custom scripts)
- Delete archived data from PV to free space
- Document archival process for data recovery if needed
Pros: Maintains compliance while reducing storage costs Cons: Archived data has slower retrieval times, requires archival infrastructure
Integration with PV Auto Expansion
PV Capacity Forecast and PV Auto Expansion work together seamlessly:
Forecast Detection: PV Capacity Forecast predicts when storage will be exhausted
Threshold Trigger: When actual usage reaches the expansion threshold (configured in PV Auto Expansion), automatic expansion is triggered
Pre-emptive Expansion: Expansion happens before capacity is reached, preventing write failures
Continuous Monitoring: After expansion, forecast adjusts to new capacity and continues monitoring
Example Flow:
- PV Capacity Forecast predicts PV will reach 100% in 14 days
- PV Auto Expansion is configured with 80% threshold
- When actual usage reaches 80%, auto-expansion increases PV size by 30%
- Forecast recalculates based on new 130% capacity
- No application downtime or write failures occur
See PV Auto Expansion documentation for configuration details.
Best Practices
- Set expansion thresholds at 70-80% capacity to allow buffer time for expansion completion
- Enable auto-expansion for critical databases to prevent write failures and downtime
- Review forecasts weekly for non-critical storage to plan manual expansions during maintenance windows
- Combine with cleanup policies to manage costs (expand when needed, but also clean up waste)
- Validate forecast accuracy by comparing predicted vs actual exhaustion dates monthly
- Document storage growth patterns to inform capacity planning and budget forecasting
- Set up alerts for forecasts showing exhaustion within 30 days for manual intervention
- Archive old data proactively rather than relying solely on expansion
- Monitor expansion costs in cloud providers to avoid surprise spending from unlimited auto-expansion
- Test expansion in staging before enabling auto-expansion for production volumes
Storage Class Requirements
PV Auto Expansion requires storage classes with allowVolumeExpansion: true. Verify your storage class supports dynamic expansion:
kubectl get storageclass -o jsonpath='{range .items[*]}{.metadata.name}{"\t"}{.allowVolumeExpansion}{"\n"}{end}'If your storage class doesn't support expansion, you'll need to manually provision larger volumes and migrate data.
Troubleshooting
Forecast Showing "Insufficient Data":
- Wait for 7 days of metrics collection after PV creation
- Verify Metrics Agent is collecting PV usage data
Forecast Seems Inaccurate:
- Check if workload behavior changed recently (new traffic patterns, data pipeline changes)
- Models require 7-14 days to adapt to new patterns
- For highly variable workloads, forecast may show wider confidence intervals
Auto Expansion Not Triggering:
- Verify expansion is enabled in PV Auto Expansion settings
- Check that threshold is set appropriately (not too high)
- Ensure storage class supports
allowVolumeExpansion - Review PV Auto Expansion logs for errors