Pod/Container Failures
A pod can show Running in kubectl while one of its containers is quietly dying: OOMKilled, restarting in CrashLoopBackOff, or exiting with an error. Pod/Container Failures detects these abnormal transitions automatically from the data the Wave agent already pushes, and captures the context you need to explain them, so you do not have to dig through kubectl or k9s after the fact.
- Zero-config. The agent observes every pod in the cluster. There is nothing to enable per workload; you can only opt out of detection for noisy workloads.
- No polling. Detection is push-driven: when the agent reports a state change, that is the trigger. There is no scrape interval to tune.
What it detects
Pod/Container Failures recognizes 11 abnormal transitions, grouped by where they happen. The What is detected? link in the page header spells out the full coverage.
Container-level (5)
| Transition | Meaning |
|---|---|
| OOMKilled | The container was killed by the kernel for exceeding its memory limit. |
| CrashLoopBackOff | The container keeps crashing and Kubernetes is backing off between restarts. |
| ContainerCrash | The container exited with a non-zero exit code (not OOM), an application-level failure. |
| UnexpectedExit0 | The container exited with code 0 unexpectedly (a process that should have kept running stopped). |
| ReadyLoss | A previously-ready container lost readiness. |
Pod-level (6)
| Transition | Meaning |
|---|---|
| PodEvicted | The pod was evicted (for example, node resource pressure). |
| PodNodeShutdown | The pod's node was shut down. |
| PodPreempted | The pod was preempted by a higher-priority pod. |
| PodAdmissionFailed | The pod failed admission on the node. |
| PodStuckTerminating | The pod is stuck in Terminating. |
| PodFailed | The pod reached a terminal Failed phase. |
For an application crash, Wave also distinguishes the likely cause: for example, a ContainerCrash points you to an app panic or exception, an unhandled signal, wrong args or env, or a dependency connection failure.
The failure timeline
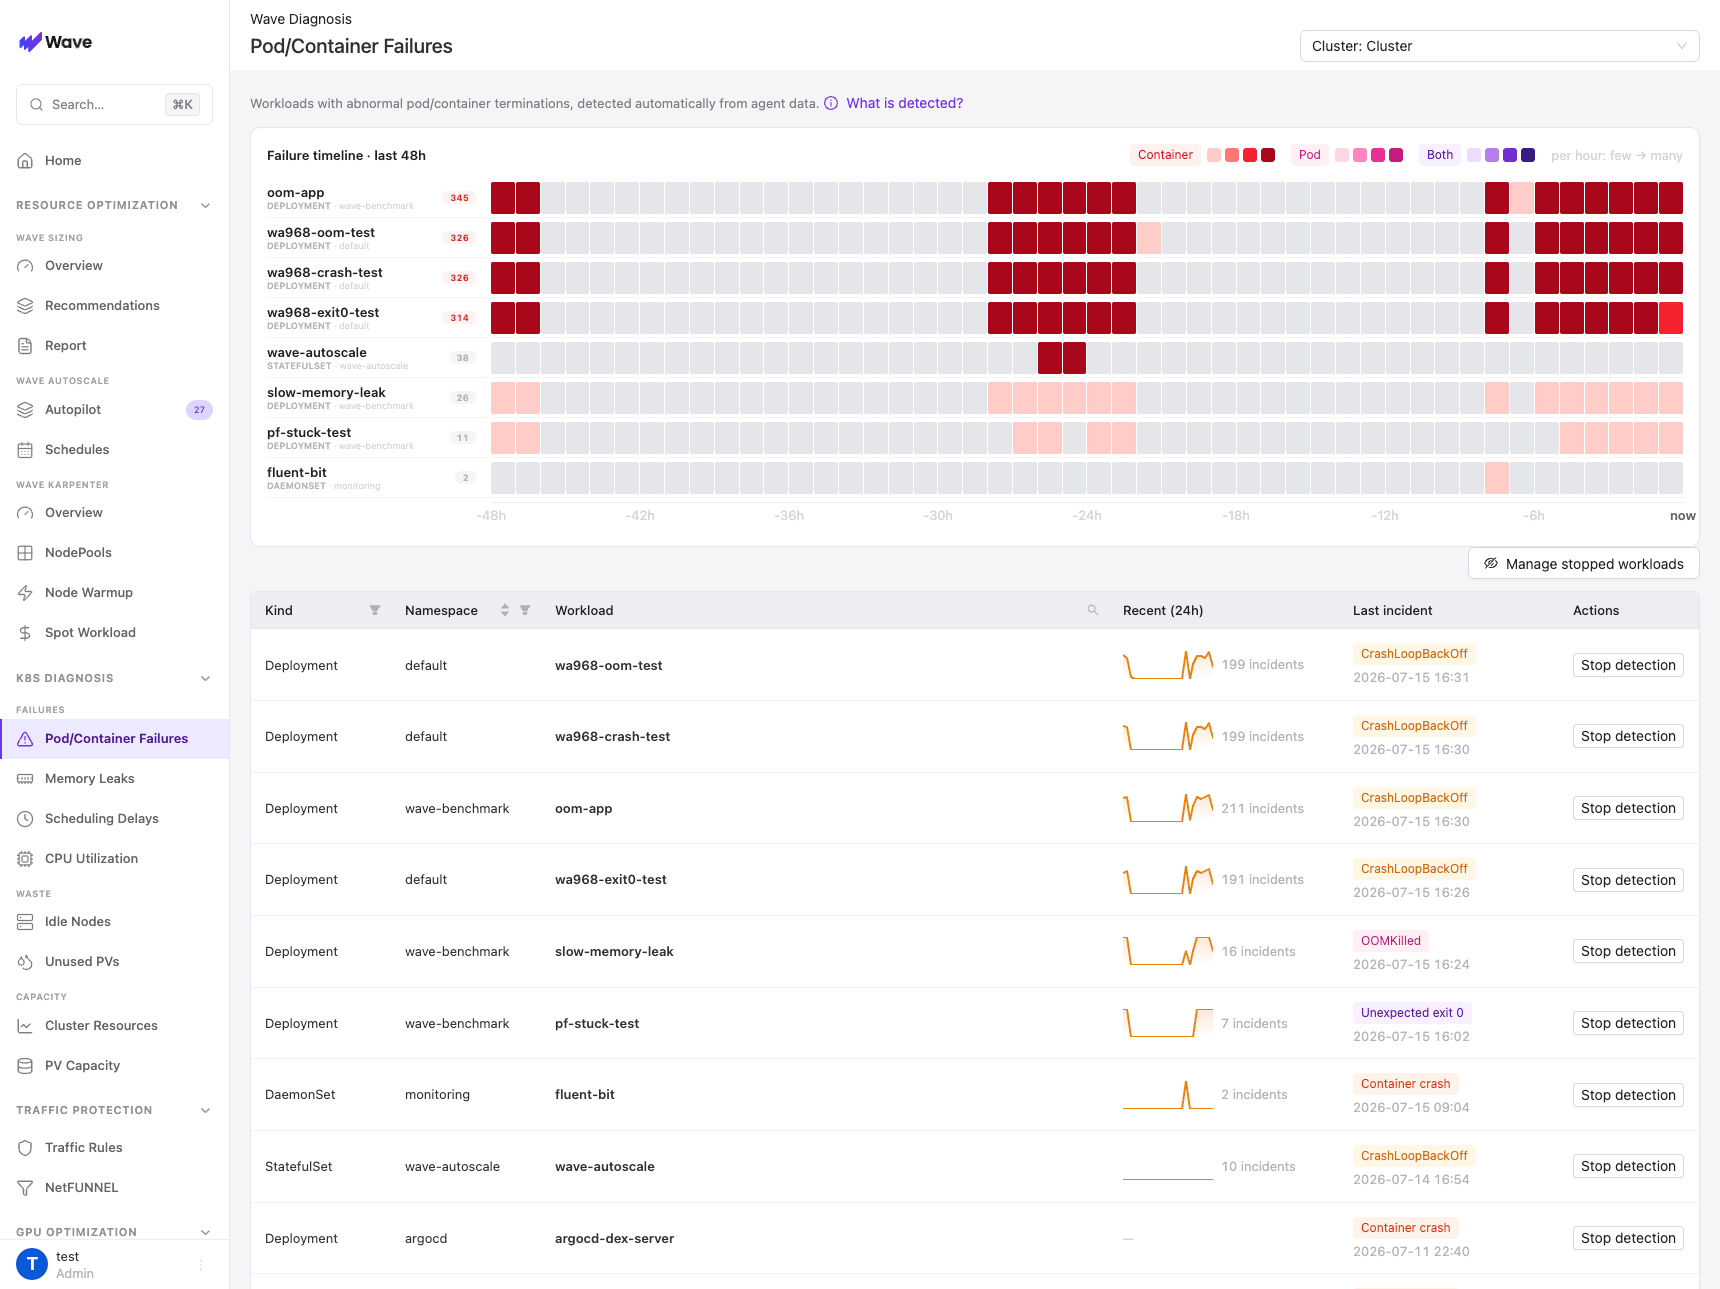
The top of the page is a 48-hour failure heatmap: one row per affected workload (with its kind, namespace, and total incident count), one cell per hour.
- Color encodes the failure family: Container, Pod, or Both.
- Intensity encodes how many incidents landed in that hour, from few to many, so a burst of crashes stands out immediately.
It shows at a glance when a workload started failing and whether the problem is ongoing or already resolved.
Workload list and drill-down
Below the timeline is the affected-workload table: Kind, Namespace, Workload (free-text searchable), a Recent (24h) incidents sparkline with a count, and the Last incident type and time (for example CrashLoopBackOff, OOMKilled, Unexpected exit 0, Container crash). Use Stop detection to mute a noisy workload, and Manage stopped workloads to bring it back.
Selecting a workload opens its detail page, scoped to a date range (the last five days by default):
-
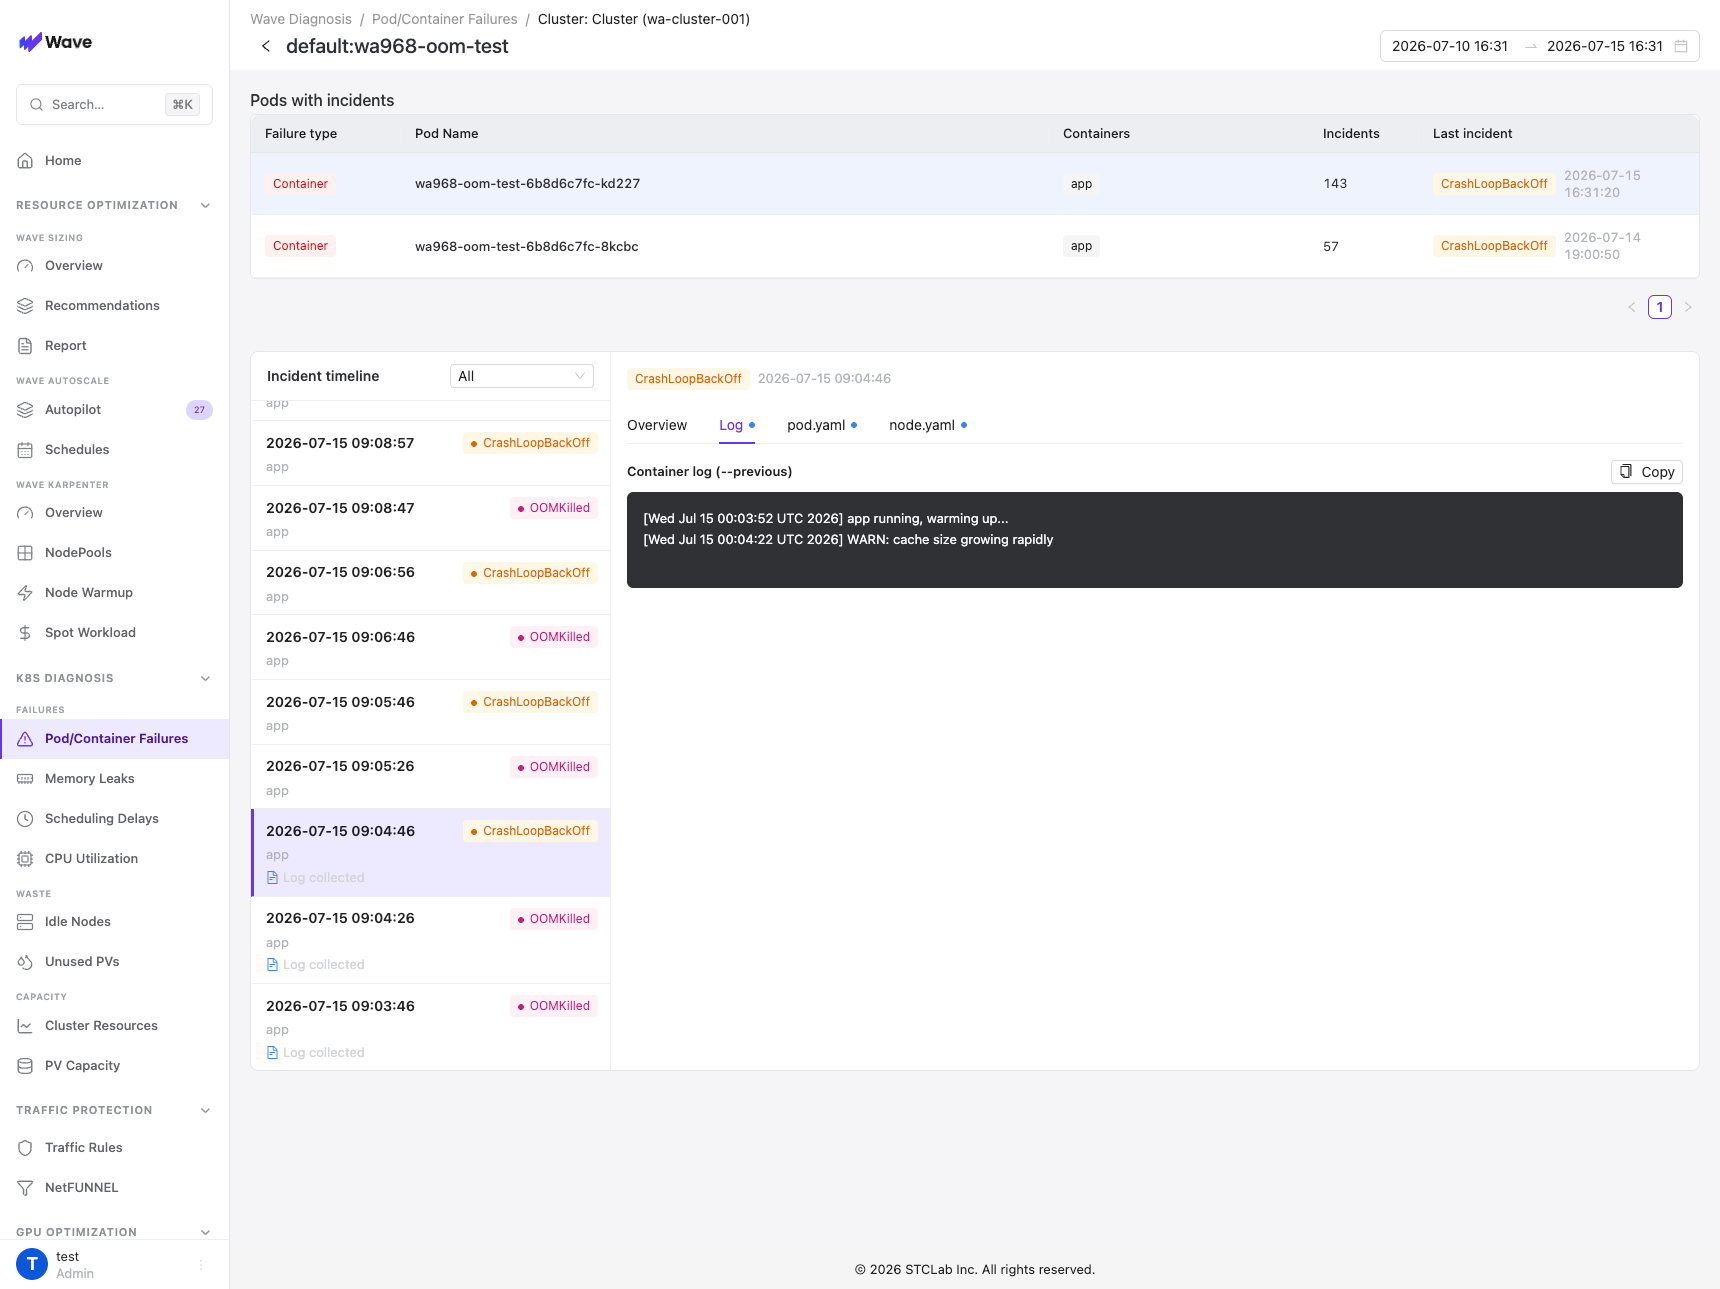
Pods with incidents lists the failing pods with Failure type (Container or Pod), Pod Name, Containers, an Incidents count, and the Last incident.
-
Incident timeline shows every detected transition over time, filterable by type. Each entry carries the time, the failure badge, the container, and a Log collected marker when Wave captured that container's log at the moment it failed.
-
Incident detail opens the selected incident in a tabbed panel:
- Overview: a plain-language explanation of what failed and what to check, with the incident's key facts (pod, container, reason, and resource state at the time).
- Log: the previous container instance's log (
kubectl logs --previous), captured at failure time, with one-click Copy. - pod.yaml and node.yaml: the captured pod and node manifests, so root-cause analysis stays in one place.
A dot on a tab means Wave captured that artifact for the incident.