Pod Scheduling Delay Detection
A pod that sits in Pending is a deployment that has not happened yet. Pod Scheduling Delay Detection tracks every pod that waited longer than expected to schedule, how long it waited, and the exact scheduler conditions behind it, so you can tell a genuine capacity shortage from a misconfigured pod spec without reading raw events. It works per workload, in real time, and needs no warm-up period.
Open it under Wave Diagnosis in the sidebar, then Scheduling Delays. The cluster selector and date-range picker (the last seven days by default) scope the chart and table; the finding banner and KPI cards summarize the last 24 hours.
The Scheduling Delays page
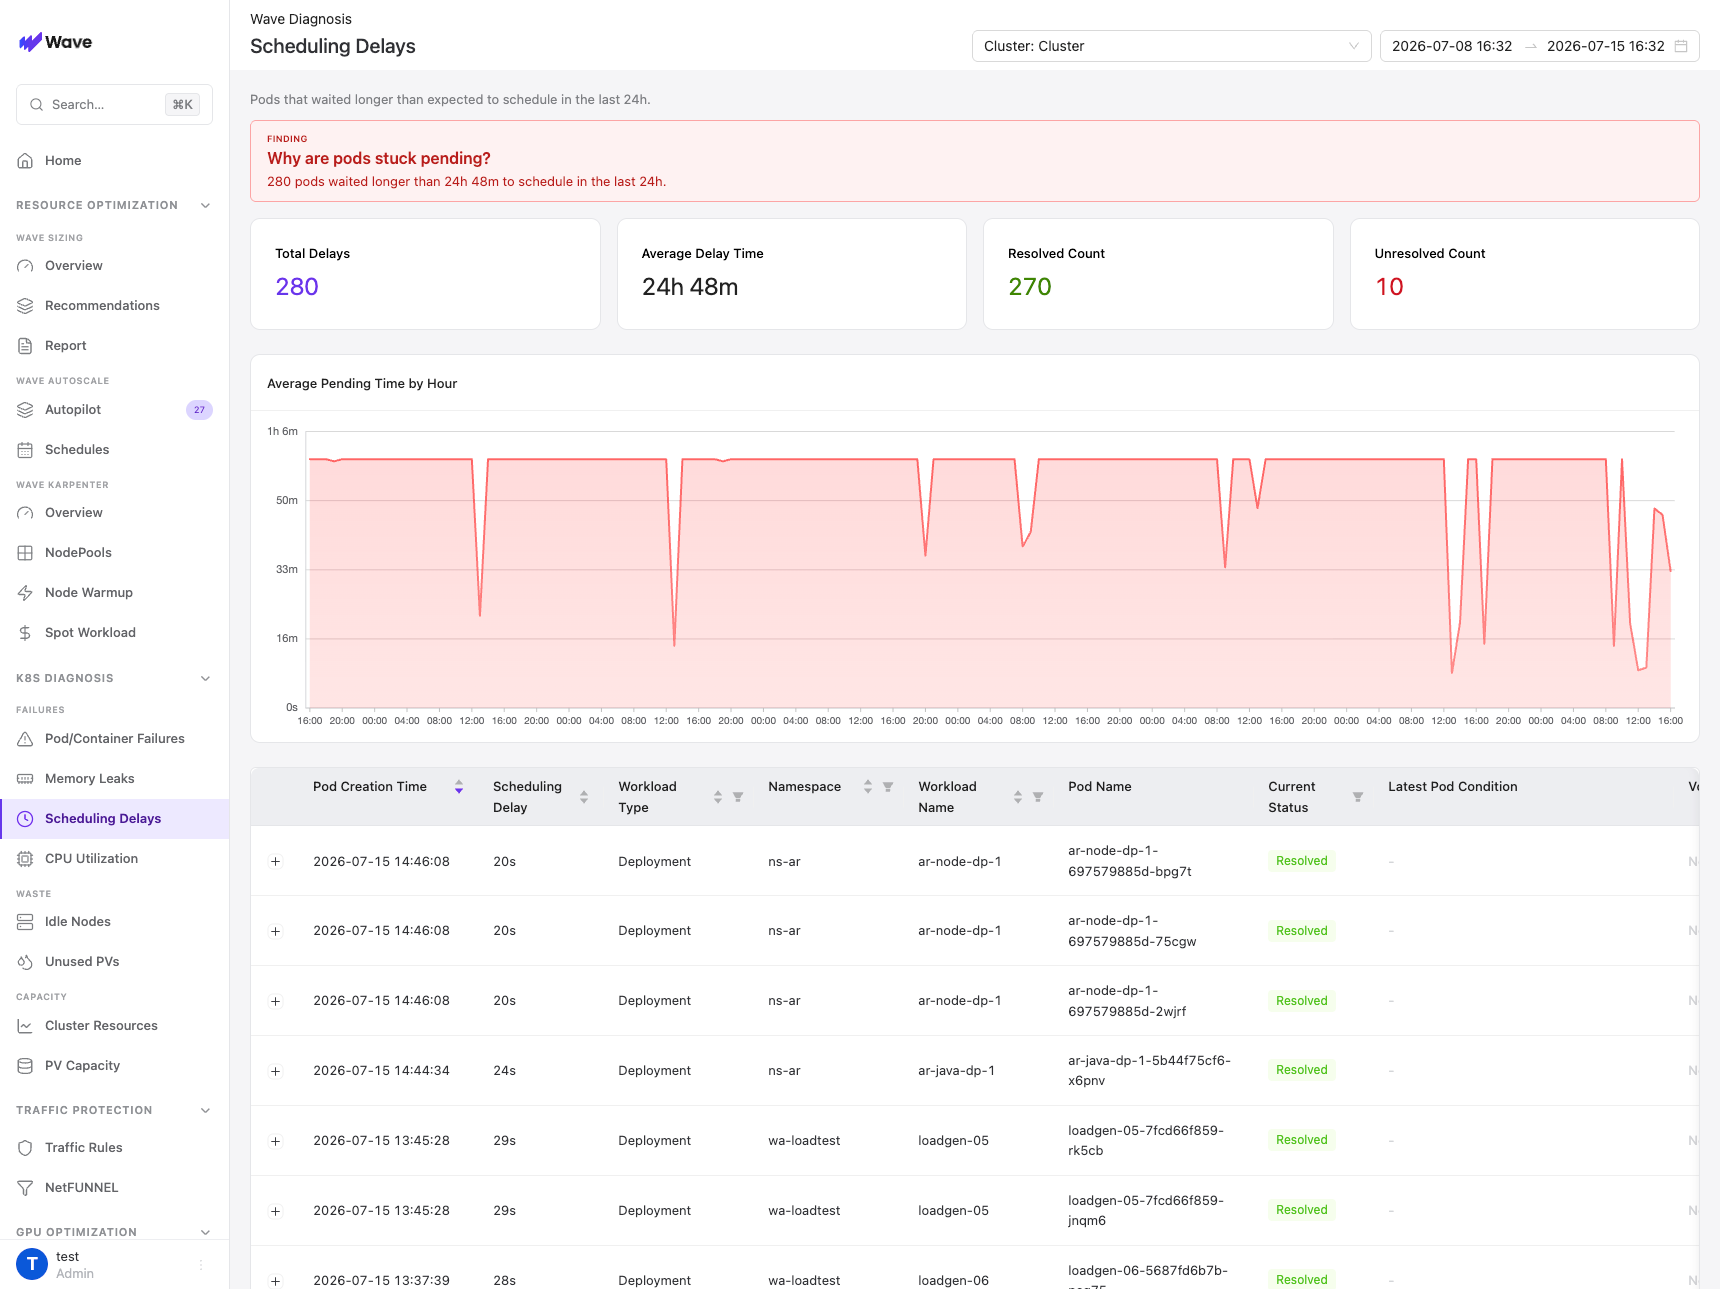
Finding banner. A one-line answer to "Why are pods stuck pending?" with how many pods waited, and for how long, in the last 24 hours.
KPI cards. Four numbers give the shape of the problem at a glance:
- Total Delays: pods that experienced a scheduling delay in range.
- Average Delay Time: mean time spent in Pending before scheduling or deletion.
- Resolved Count: delays that cleared (the pod eventually scheduled).
- Unresolved Count: delays still pending. A rising number here means active, ongoing scheduling problems.
Average Pending Time by Hour. An hourly area chart of mean pending time across the selected range. Use it to spot when delays cluster, for example around deploy windows or peak hours, and to confirm that a fix actually moved the line.
Delays table. One row per delayed pod, sortable and filterable: Pod Creation Time, Scheduling Delay, Workload Type, Namespace, Workload Name, Pod Name, Current Status (Resolved or Pending), Latest Pod Condition, and Volume Issues. Filter by workload type, namespace, workload name, or status to isolate one problem.
Expandable row details
Click the + on any row to expand the full diagnosis for that pod.
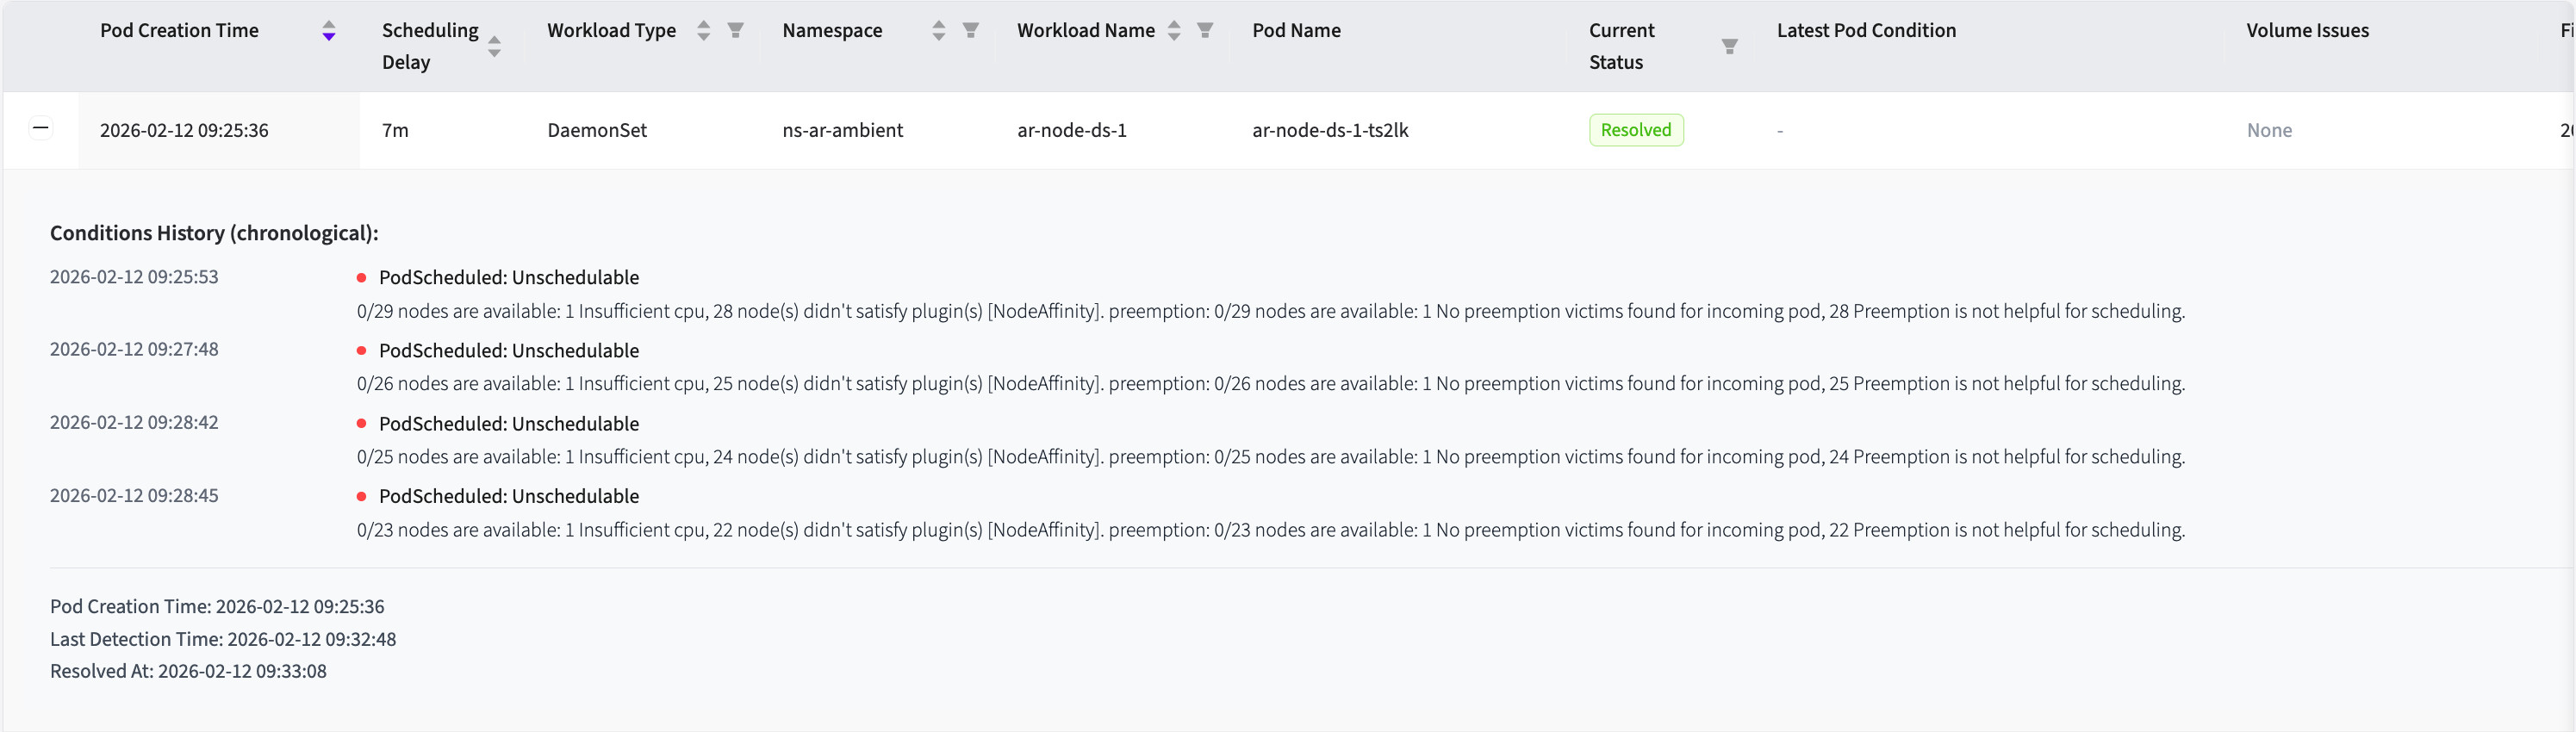
- Conditions history lists every scheduler condition in chronological order, each with a timestamp, a color-coded badge (type, reason, status), and the scheduler's own message, for example
0/5 nodes are available: 2 Insufficient cpu, 3 node(s) had taint that the pod did not tolerate. Reading it top to bottom shows how the delay evolved. - Volume binding history appears only for pods that use PersistentVolumeClaims. For each pending PVC it shows the name and namespace, the binding phase, the requested storage and class, and the binding failure reason (for example, no available volumes or a zone mismatch).
- Timestamps summarize the pod creation time, the last detection time, and when the delay resolved.
Common Scheduling Failure Reasons
The Latest Pod Condition column and the conditions history surface the scheduler's own reason. Match it against the family below and apply the fix.
Condition messages
PodExceedsFreeCPU/PodExceedsFreeMemory- "Insufficient CPU" or "Insufficient memory"
Root causes
- No node has enough free CPU or memory to satisfy the pod's resource requests
- Pod count limit reached (max pods per node)
- Cluster at capacity during peak usage
Quick fixes
Emergency (immediate):
# Delete unused pods to free resources
kubectl delete pod <unused-pod> -n <namespace>

# Reduce resource requests temporarily
kubectl set resources deployment <name> -c=<container> --requests=cpu=500m,memory=512Mi
Sustainable (long-term):
- Add more nodes to the cluster via your cloud provider
- Enable Cluster Autoscaler for automatic node provisioning
- Use Smart Sizing to optimize resource requests
- Review the Sizing Console for cluster-wide over-provisioning
Related
- Wave Diagnosis Overview
- Cluster Resource Forecast: predict when capacity will run short.
- Idle Node Detection: delays despite idle nodes point to taints, labels, or affinity.
- PV Capacity Forecast: volume-binding delays that trace back to storage exhaustion.