Memory Leak Detection
Ordinary memory usage looks like a sawtooth: it climbs, garbage collection frees it, it climbs again. A leak looks different: the low point of each cycle keeps rising. Memory Leak Detection watches that floor, the hourly minimum memory per container, and flags workloads whose floor trends upward, so you can schedule a restart or fix the code before the workload OOMKills in production.
The Memory Leaks screen (under Wave Diagnosis) has two tabs that answer two different questions:
- Memory Leak Detection: which workloads are leaking, how fast, and how much.
- Possible OOM Risk: which workloads are running close to their memory limit right now, leak or not.
Both are scoped by the date-range picker in the top right (the last few days by default) and the cluster selector.
What counts as a leak
A rising floor is the signal. On top of it, Wave classifies each detection into one of two patterns, shown as a badge in the console: Steady Growth and Trend Based Growth. Every detection records the baseline memory, the recent memory, the increase % (and hourly increase %), and a confidence score, so a fast, high-confidence jump stands out from slow noise.
Detection patterns
Steady Growth
A slow, gradual climb with very few dips, memory that goes up and rarely comes back down. It points to a slow leak in a long-running service.
- Common causes: connection pools that never close, unbounded caches with no eviction, event listeners that accumulate, file handles or sockets that are never released.
- Example: a web service that leaks about 50 MB a day trips Steady Growth after a few days of a consistently rising floor.
Trend Based Growth
A fast climb that a statistical trend fit backs with high confidence. It points to an aggressive leak that will reach OOM quickly.
- Common causes: goroutine leaks (Go), thread leaks (Java), recursion without a termination path, unbounded queues or buffers.
- Example: a Go service leaking goroutines that together consume about 200 MB in 24 hours trips Trend Based Growth with high confidence.
Memory Leak Detection tab
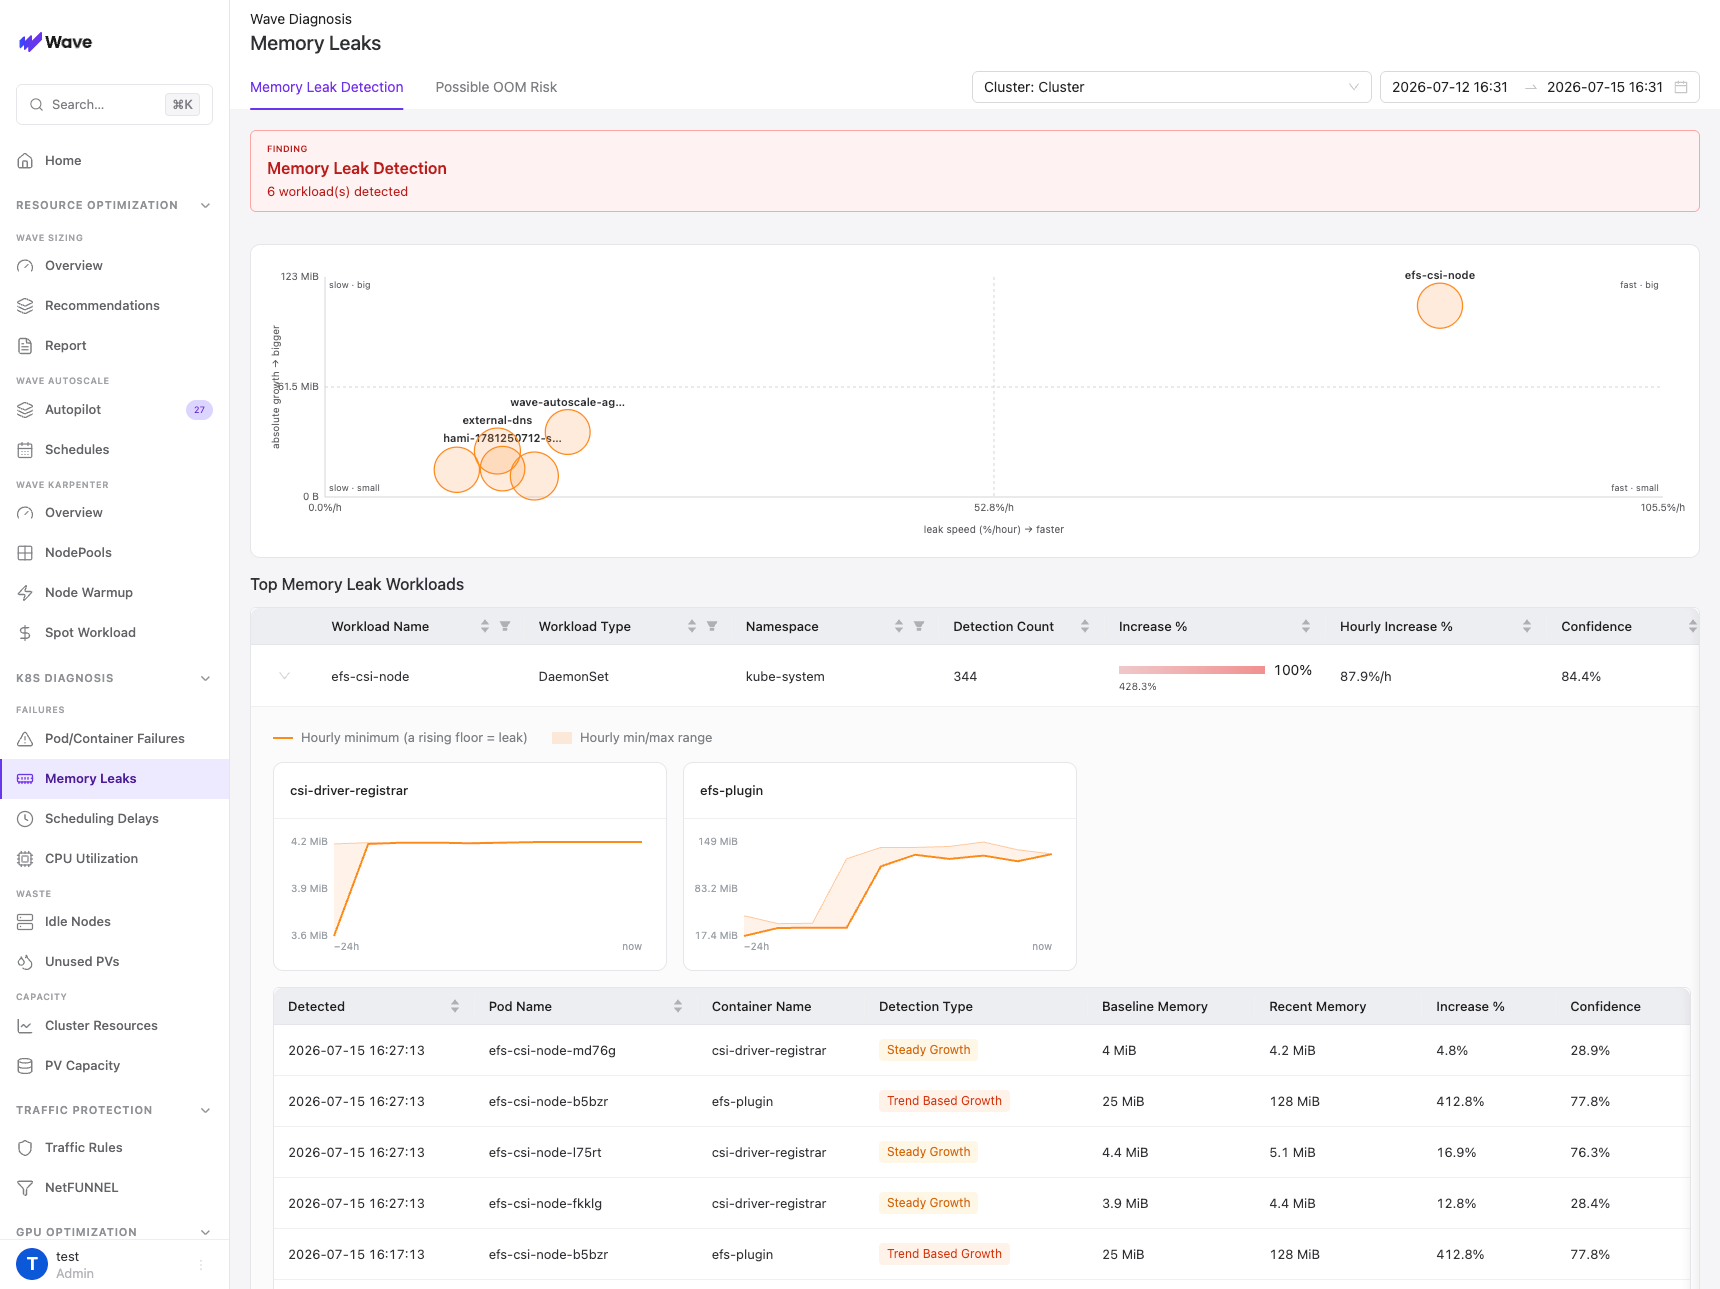
A finding banner at the top states how many workloads are leaking (for example, "6 workload(s) detected"), so you know at a glance whether anything needs attention.
Triage chart. A bubble chart places every leaking workload by leak speed (percent per hour, x-axis) against absolute growth (Mi, y-axis). The corners read slow and small to fast and big; the workloads in the top-right are leaking both fast and large, so act on those first.
Top Memory Leak Workloads. The table below lists each workload with Workload Name, Workload Type, Namespace, Detection Count, Increase %, Hourly Increase %, and Confidence, sorted with the worst on top. Expand a row to see:
- Per-container floor charts: an orange line for the hourly minimum (a rising floor means a leak) with the hourly min/max range shaded around it.
- A per-detection table: Detected, Pod Name, Container Name, Detection Type (Steady Growth or Trend Based Growth), Baseline Memory, Recent Memory, Increase %, and Confidence.
Possible OOM Risk tab
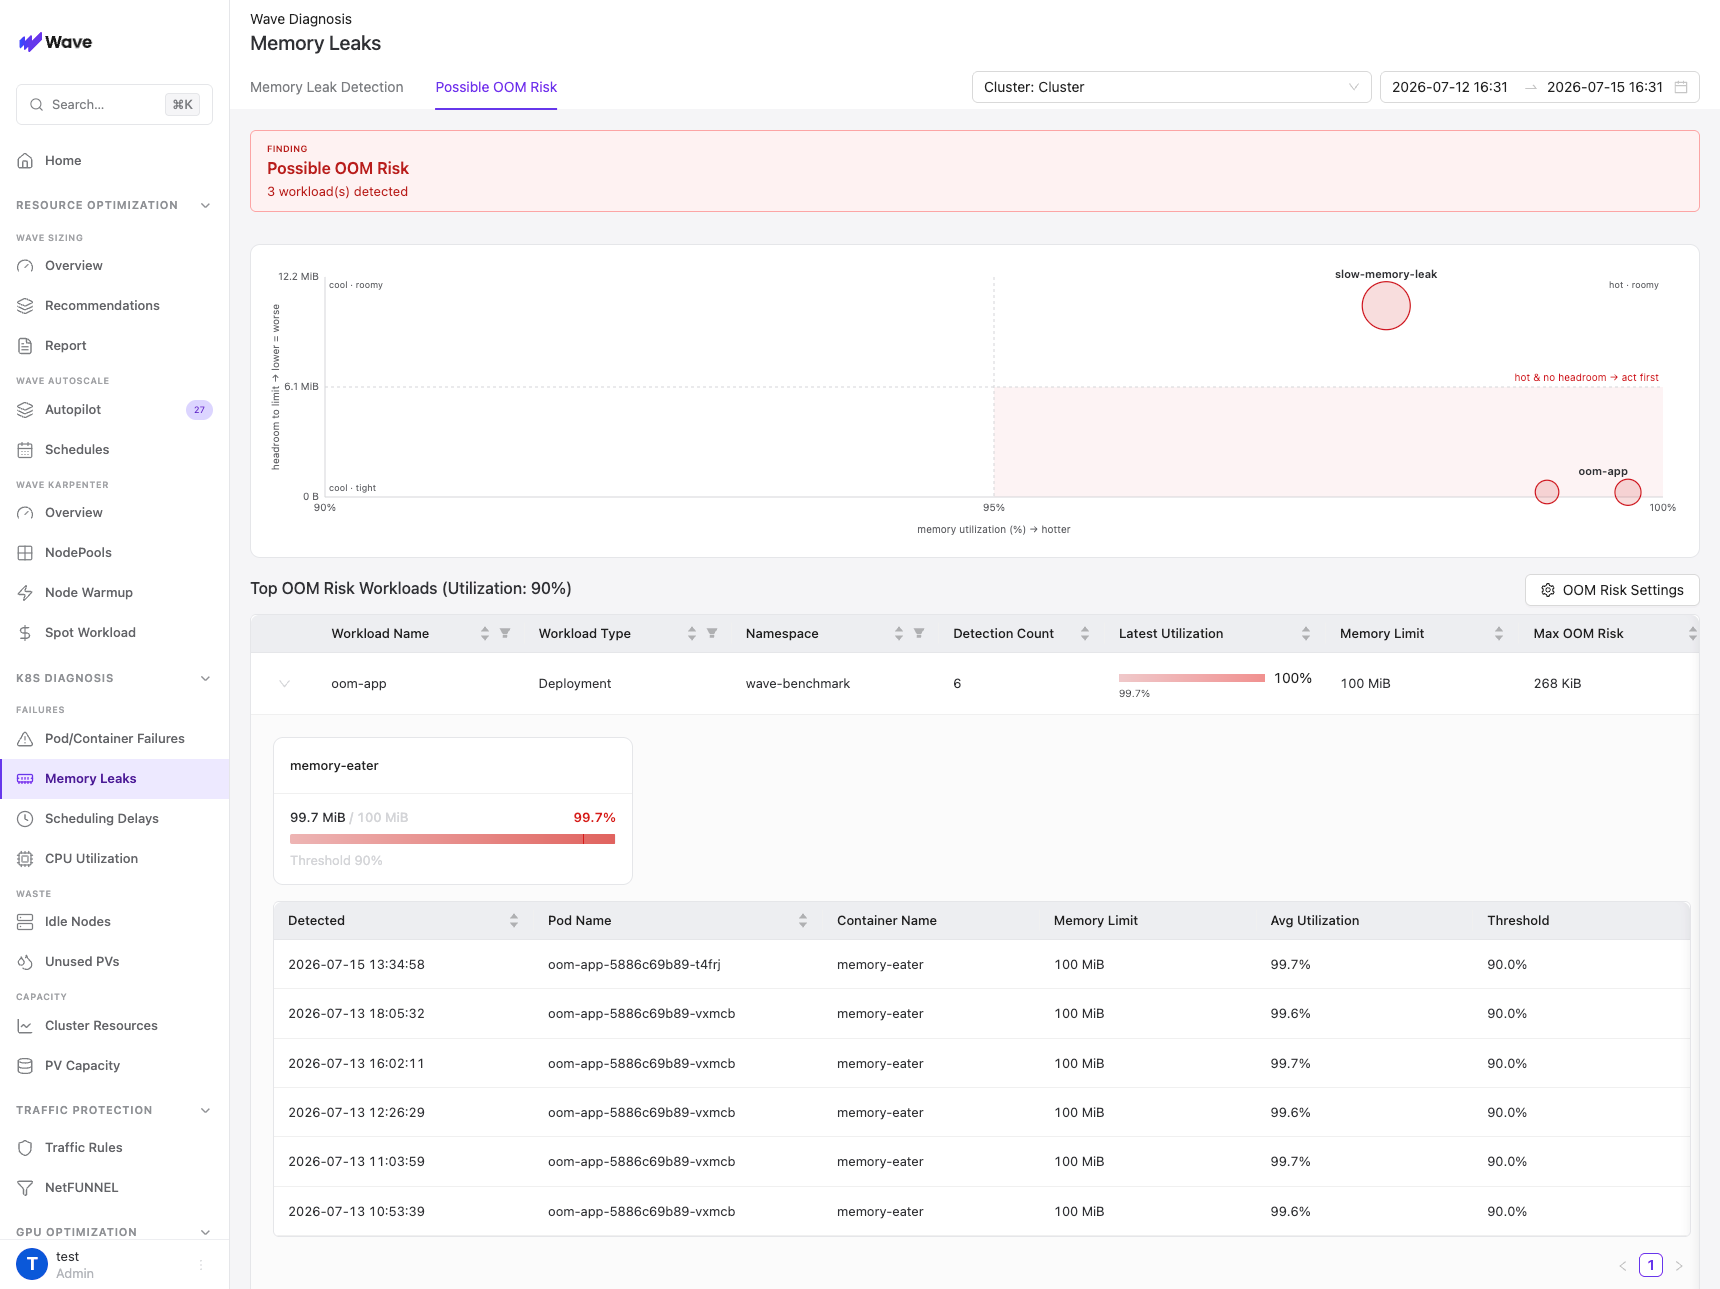
Leak detection tells you the trend; OOM risk tells you how close a workload is to the wall right now. This tab flags workloads whose memory utilization is near their limit, whether or not a leak is detected.
Triage chart. A bubble chart places workloads by memory utilization (percent of limit, x-axis) against headroom to the limit (Mi, where lower is worse, y-axis). A shaded "hot and no headroom, act first" zone in the corner marks workloads pinned near 100% with nothing left to give.
Top OOM Risk Workloads. The table header shows the active utilization threshold (Utilization: 90% by default). Columns are Workload Name, Workload Type, Namespace, Detection Count, Latest Utilization, Memory Limit, and Max OOM Risk (the smallest headroom seen). Expand a row for per-container utilization cards (for example, memory-eater at 99.7 MiB of a 100 MiB limit, 99.7%, against a 90% threshold) and a per-detection table: Detected, Pod Name, Container Name, Memory Limit, Avg Utilization, and Threshold.
OOM Risk Settings. The utilization threshold that decides what counts as "at risk" defaults to 90% and is adjustable with the OOM Risk Settings button above the table.
Leak and OOM risk are independent
The two tabs measure different things, and a workload can appear on one without the other:
- High OOM risk, no leak: the workload genuinely needs more memory. Raise the limit or right-size it with Smart Sizing.
- A leak, no OOM risk yet: the floor is rising but there is still headroom. You have time to fix it, but the clock is running.
When the same workload shows up on both tabs, treat it as urgent: the leak is what will drive it into an OOMKill.
Use cases
Proactive restart scheduling
Catch the leak early, estimate the time to OOM from the growth rate, and schedule a clean restart in a maintenance window before it crashes. The memory resets and no user notices, which turns a 3 a.m. page into a planned change.
Memory profiling and code fixes
Use the detections to aim your profiling. Find which workloads leak most often, correlate the start of the leak with a deploy or version, run a language profiler (pprof, heapdump, VisualVM) on the flagged container, fix the root cause, and confirm the pattern stops appearing.
Capacity planning and limit adjustment
Tell a leak apart from a genuine need for memory before you touch limits. If it is a leak, fix the leak rather than raising the limit around leaked memory. If there is no leak, the workload really does need more, so raise the limit or right-size it with Smart Sizing.
Notes
- Memory Leak Detection analyzes up to about five days of hourly, per-container memory metrics from the WA Metrics Agent.
- Both tabs load scalar summaries first and fetch the time-series only when you expand a workload, so the view stays responsive on large clusters.
- A leak's pattern resets when the pod restarts. If a detection disappears right after a restart, expect it to return within a few days unless the underlying code is fixed.