Rethinking Kubernetes Observability
Author: Thomas Mathew (opens in a new tab) Date: March 11, 2026
TL;DR:
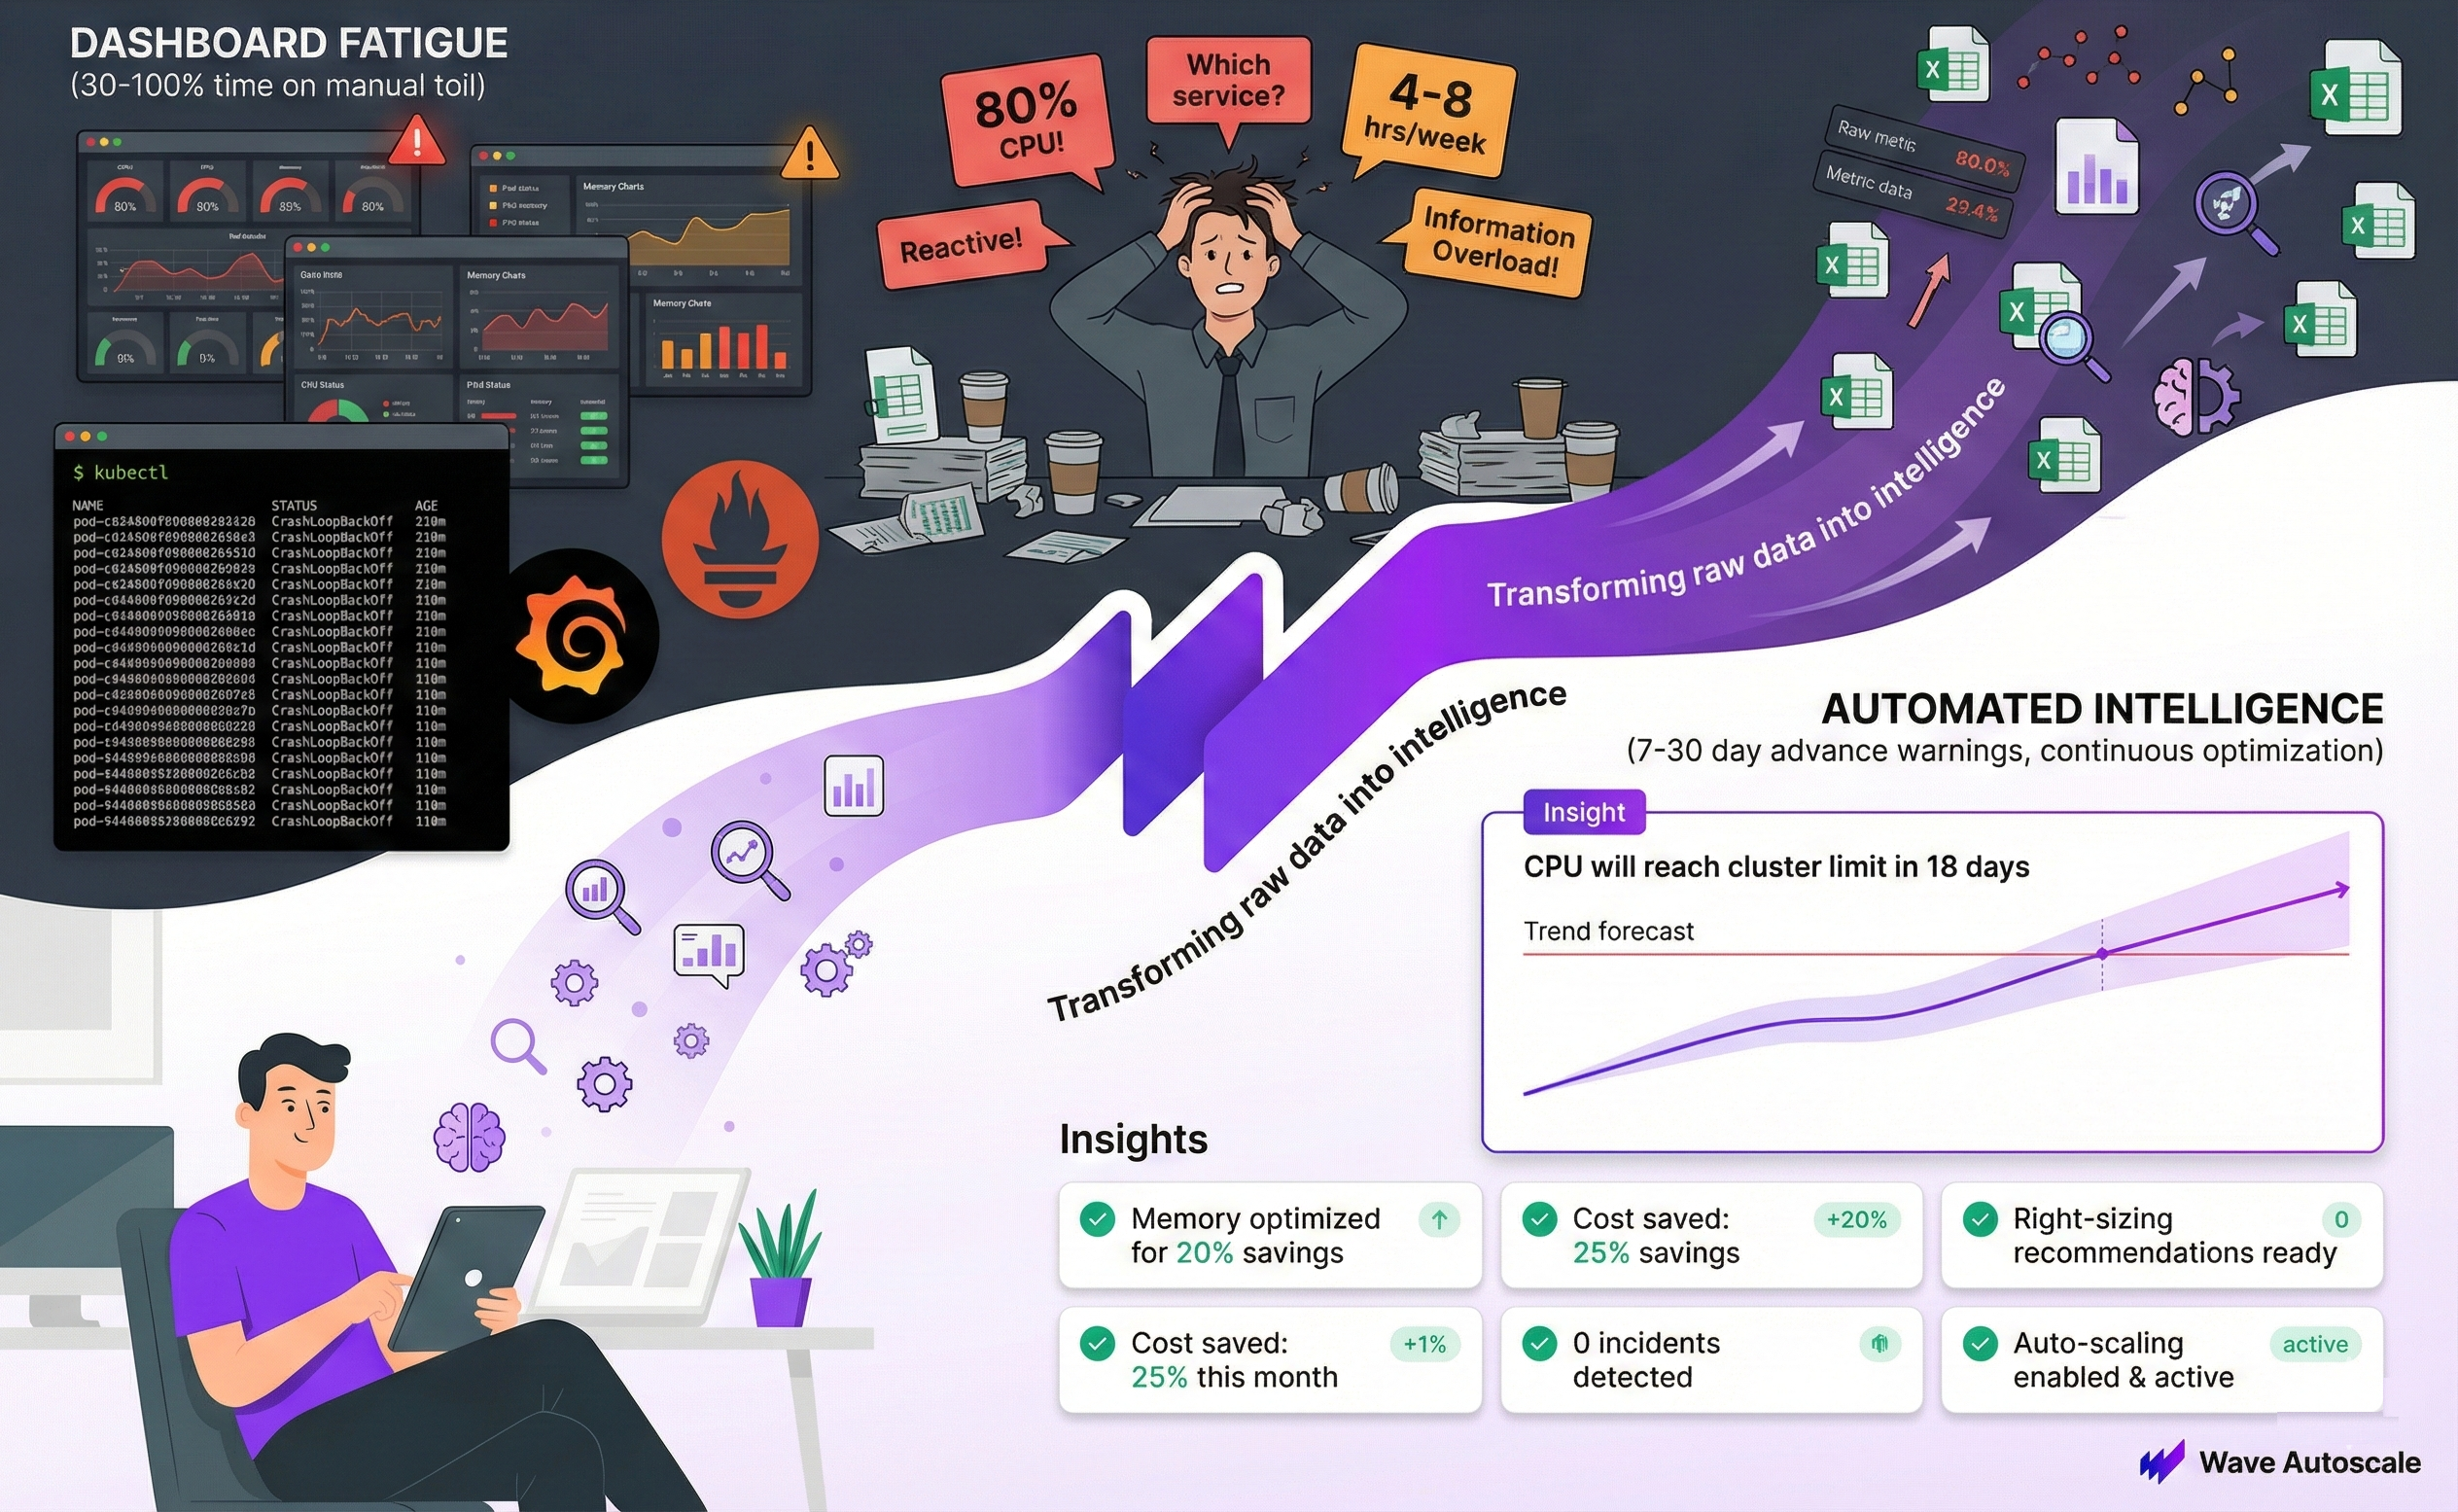
According to Catchpoint's 2023 SRE Report (opens in a new tab), teams spend 30-100% of their time on manual, repetitive tasks analyzing Kubernetes metrics. CNCF's 2023 FinOps Microsurvey (opens in a new tab) found that 49% of organizations see increased cloud costs after Kubernetes adoption, with 70% citing over-provisioning as the root cause.
Manual rightsizing requires 25-100 hours/month for clusters with hundreds of workloads. Wave Autoscale transforms this operational overhead into automated intelligence: advance warning (7-30 days before saturation), automated root cause analysis, and continuous optimization that identifies 40-60% resource waste.
Key Takeaways
- 30-100% of engineering time spent on manual Kubernetes operations toil (Catchpoint SRE Report 2023 (opens in a new tab))
- 49% of containers use less than 30% of their requested CPU (Datadog 2020 Container Report (opens in a new tab))
- 49% of organizations experience increased cloud costs after Kubernetes adoption (CNCF FinOps Microsurvey 2023 (opens in a new tab))
- Manual rightsizing: 25-100 hours/month for organizations with hundreds of workloads
- CPU utilization misleads: Often represents memory stalls, not processor bottlenecks (Brendan Gregg (opens in a new tab))
- Wave Autoscale Insights: Automated early warning (7-30 days advance notice), root cause analysis, and continuous waste detection
The Hidden Cost of Kubernetes Operations
Platform engineering teams face a recurring operational challenge: analyzing weekly Prometheus and Grafana dashboards to understand cluster health.
When CPU usage spikes to 85% on Thursday, critical questions arise.
Is this a genuine capacity constraint or a transient traffic anomaly?
Which services are consuming resources inefficiently?
Should the team provision additional nodes or optimize existing pod configurations?
The analysis cycle consumes two to three days from initial dashboard review through data compilation in spreadsheets to final decision-making. This pattern repeats weekly, consuming a substantial portion of engineering capacity.
This represents the current state for most Kubernetes operations teams. Modern observability stacks — Prometheus, Grafana, cAdvisor, kube-state-metrics — collect comprehensive telemetry data. However, transforming this raw data into actionable operational insights requires significant manual effort and domain expertise.
According to Catchpoint's 2023 SRE Report (opens in a new tab), teams spend an average of 30% of their time on manual, repetitive, automatable tasks. In some organizations, this number reaches 90-100%. The critical question isn't whether your team has access to Kubernetes data. The question is: how much engineering time are you spending to turn that data into decisions?
How Teams Currently Use Kubernetes Metrics
Let's break down the typical weekly and monthly operational workflows that engineering teams follow to gain insights from Kubernetes.
1. Reliability Analysis (Manual Process)
The Current Workflow:
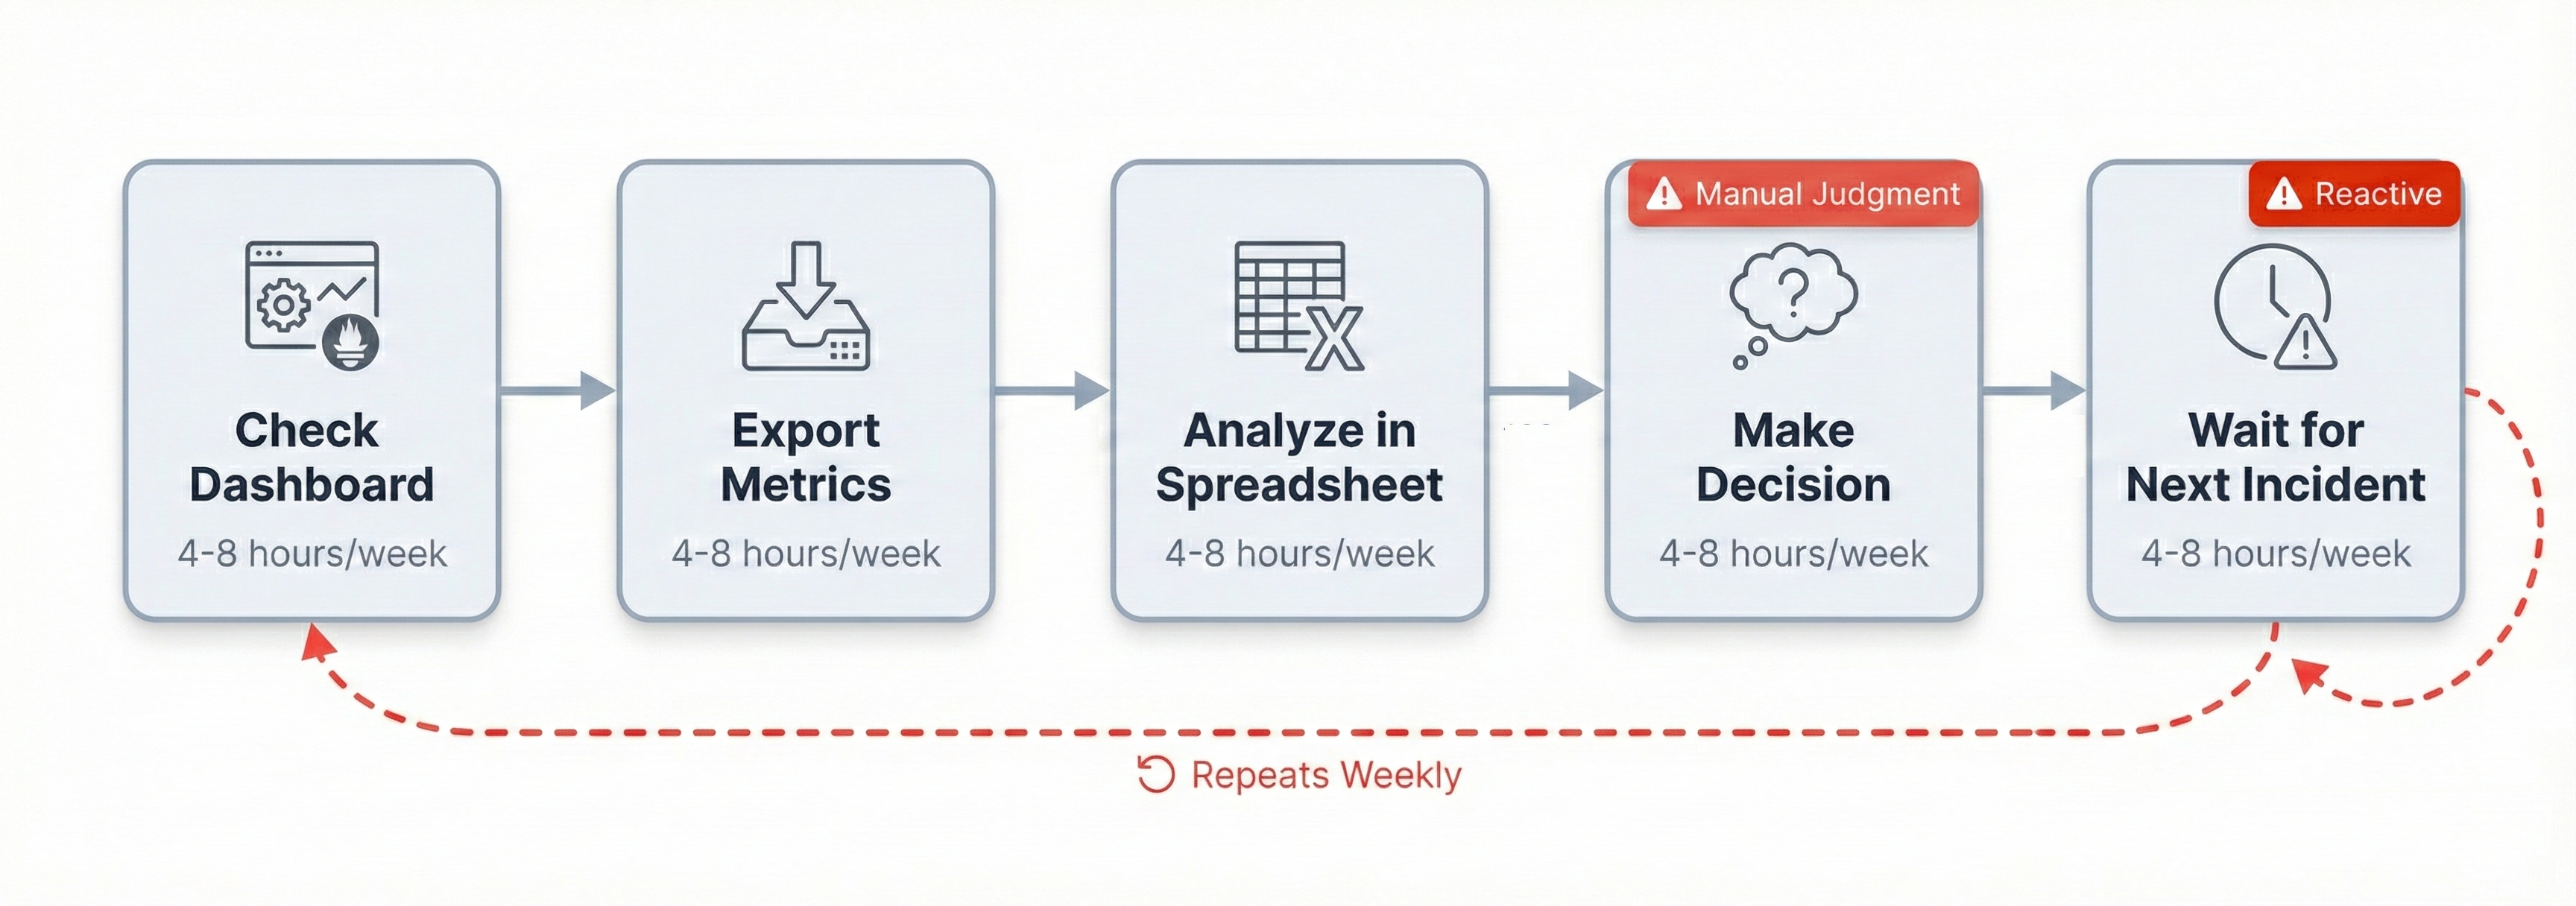
- Engineers manually review cluster CPU/memory trends weekly
- Check for capacity issues by analyzing Prometheus/Grafana dashboards
- Respond to threshold-based alerts (typically 80% usage triggers)
- Time investment: 4-8 hours/week per engineer
Why This Approach Falls Short:
By the time a threshold-based alert fires at 80% CPU, it's already too late to plan a graceful capacity expansion. Teams are forced into emergency mode, adding nodes reactively instead of planning during maintenance windows.
Industry Reality:
According to Catchpoint's 2023 SRE Report (opens in a new tab), 30% of SRE time is spent on manual toil, with extreme cases reaching 90-100%. Additionally, Red Hat's 2024 State of Kubernetes Security report (opens in a new tab) found that 40% of organizations discovered configuration errors in their Kubernetes environments.
2. Performance Troubleshooting (Manual Investigation)
The Current Workflow:
- Pod scheduling delays are noticed when users complain
- Engineers run manual
kubectlinvestigations to find the root cause - Hunt through logs and events for clues
- Time to resolution: Hours to days
Why This Approach Falls Short:
As performance expert Brendan Gregg points out (opens in a new tab), CPU utilization percentages can be deeply misleading. High CPU% may indicate memory stalls rather than processor bottlenecks — causing teams to scale the wrong resource.
3. Cost Optimization (Quarterly Manual Exercises)
The Current Workflow:
- Quarterly resource right-sizing exercises
- Export metrics → spreadsheet analysis → calculate new resource requests using percentiles
- Idle nodes and orphaned storage go unnoticed for months
- Analysis overhead prevents regular optimization
- Time investment: 25-100 hours/month for organizations with hundreds of workloads
Why This Approach Falls Short:
Developers tend to over-provision. Developers request 500m CPU when 200m is enough. They ask for 1Gi memory when 400Mi would work. It's the "just in case" buffer that becomes permanent waste.
Industry Reality:
Datadog's 2020 container research (opens in a new tab) found that 49% of containers use less than 30% of their requested CPU, and 45% use less than 30% of their requested memory.
The CNCF's 2023 FinOps Microsurvey (opens in a new tab) revealed an even bigger picture:
- 49% of organizations experienced increased cloud costs after Kubernetes adoption
- 70% cited over-provisioning as the root cause
The Core Problems with Manual Analysis
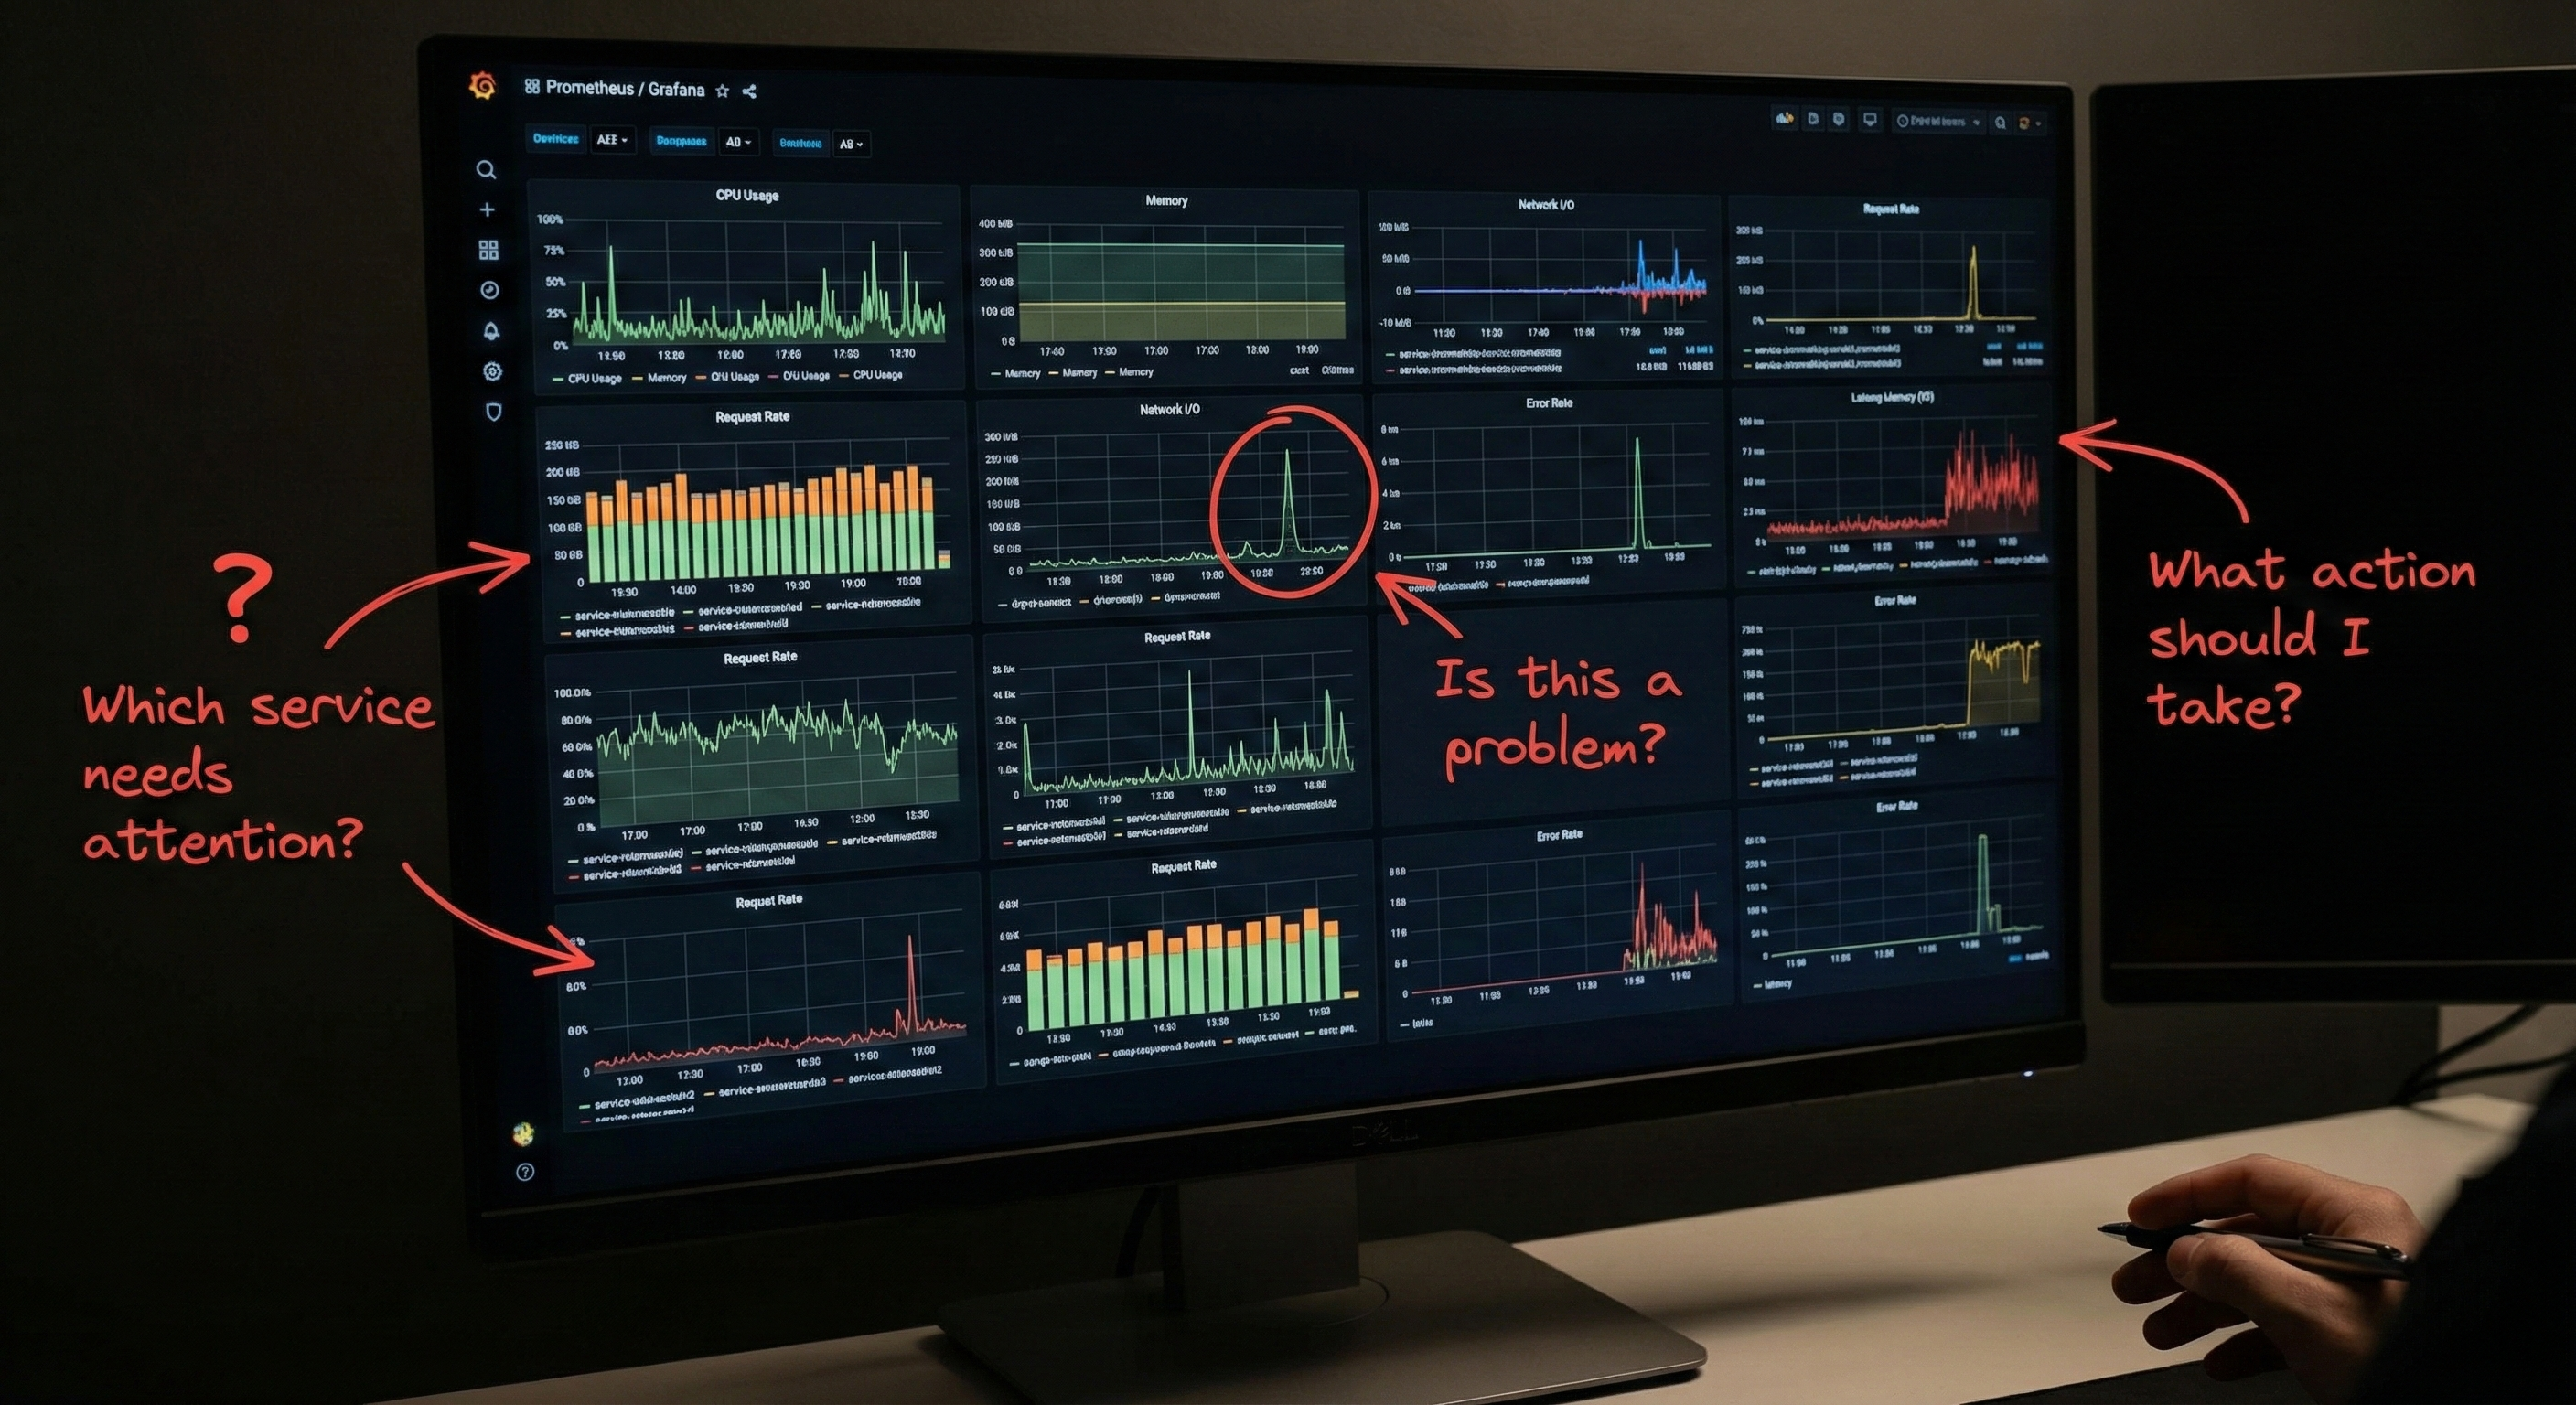
- After-the-fact analysis instead of advance warning: By the time you notice a trend in dashboards, it's already impacting production
- Tribal knowledge required: Analysis quality depends on engineer skill and institutional memory
- Data exists but insights require manual compilation: Metrics are collected, but transforming them into decisions takes hours
- High cognitive load: Dashboard fatigue and alert fatigue drain engineering focus
- Opportunity cost: Time spent analyzing metrics = time NOT building features
- Knowledge loss on turnover: CISIN's knowledge transfer study (opens in a new tab) found 42% knowledge loss when staff turnover exceeds 20%
Wave Autoscale's Automated Intelligence Approach
Wave Autoscale transforms the manual workflows described above into automated intelligence. Let's explore how it addresses each operational scenario.
Reliability Insights: Automated Early Warning
Cluster Resource Forecast
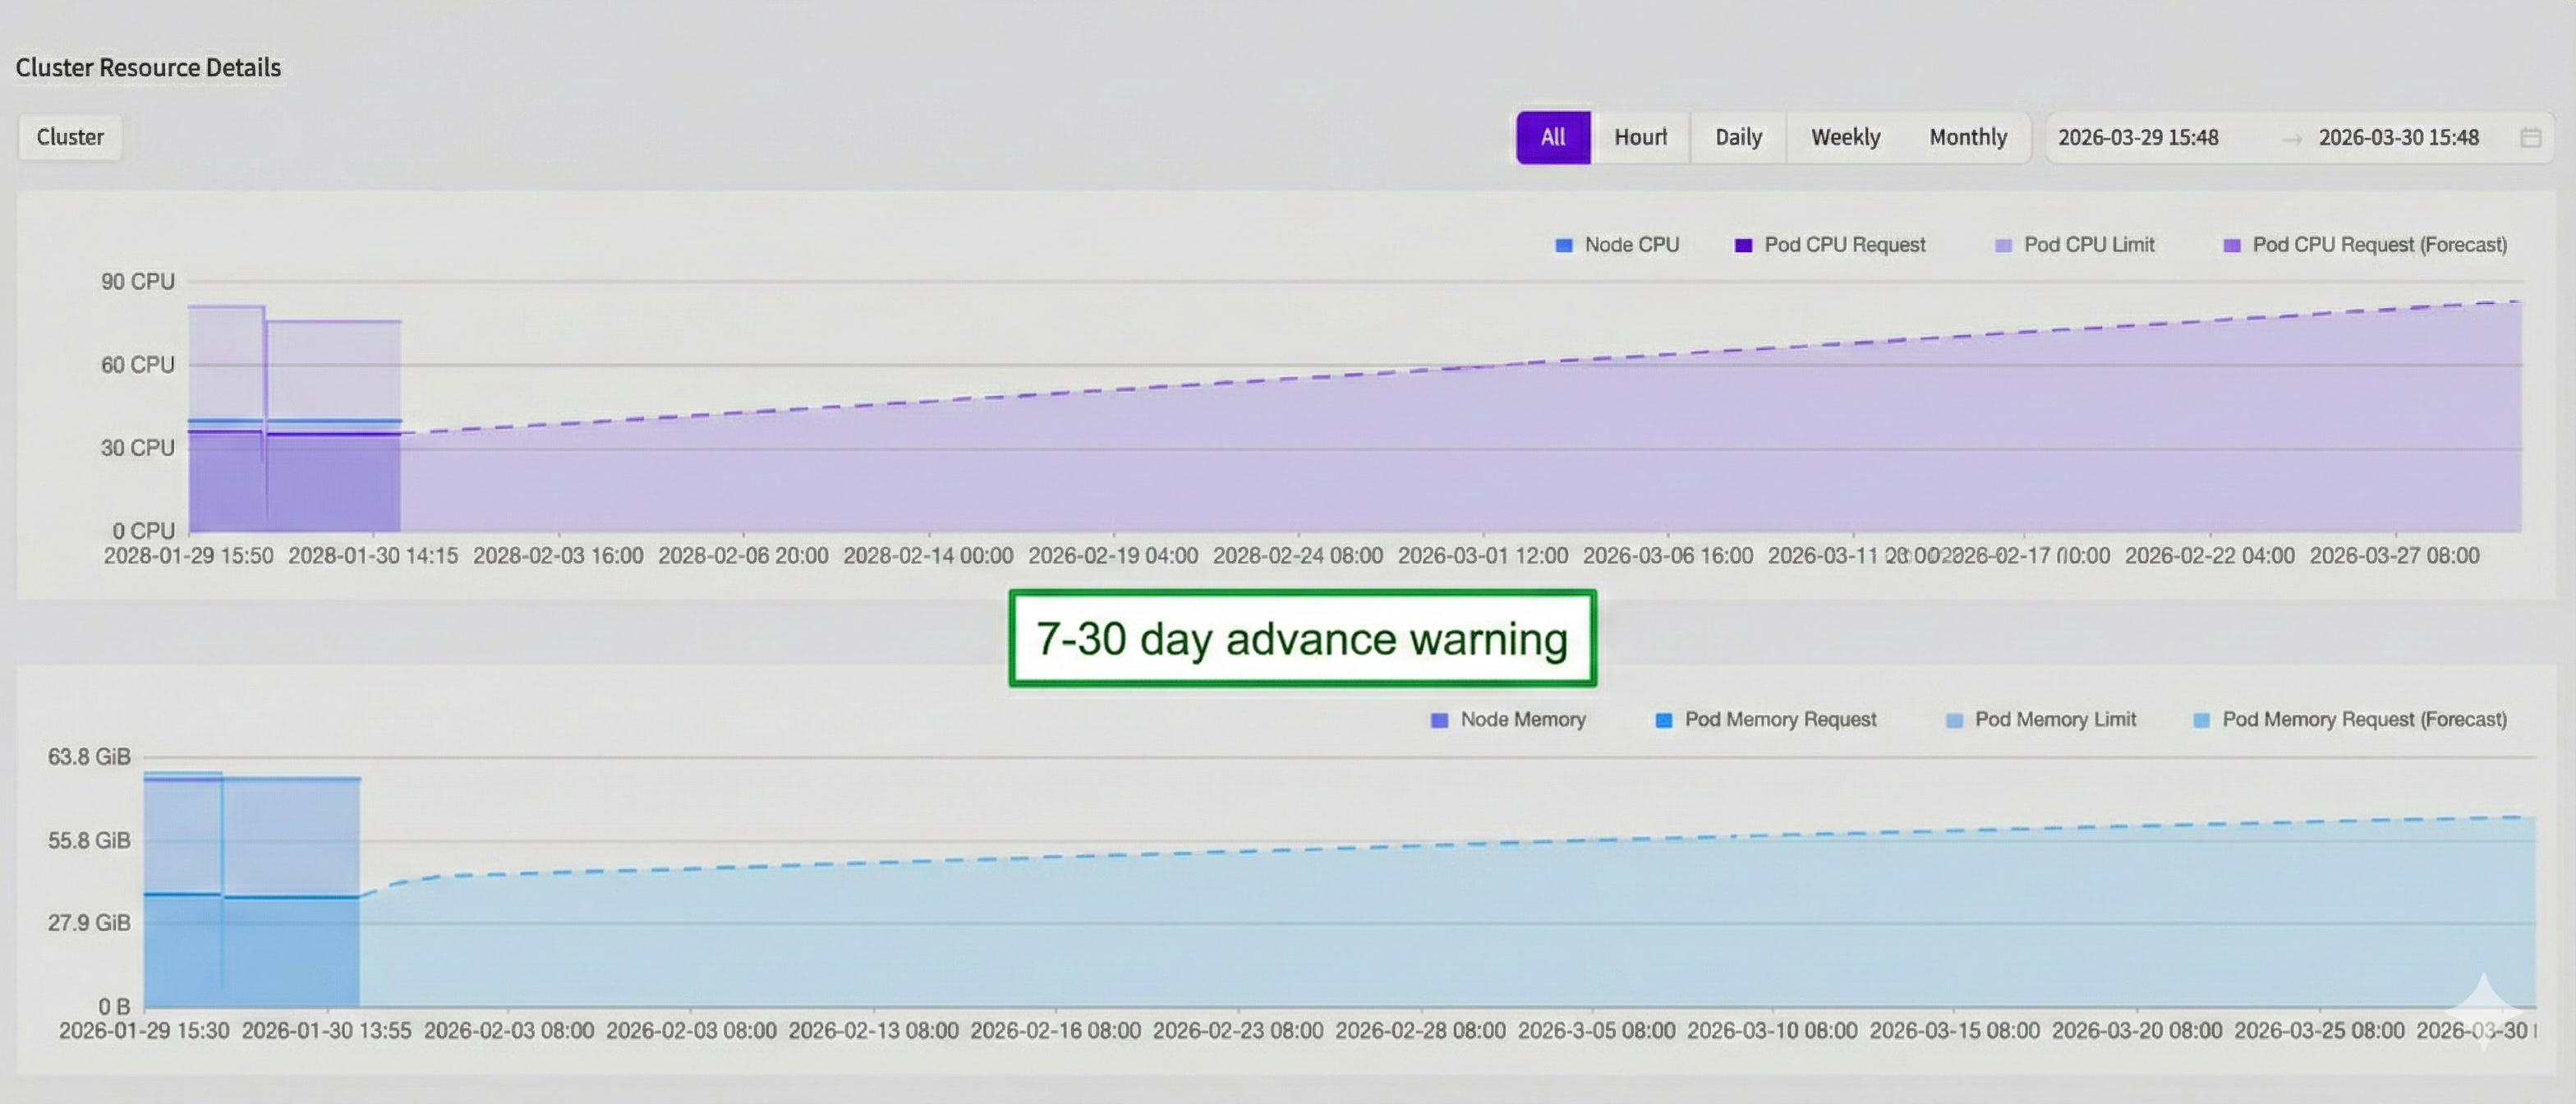
Analyzes historical trends to forecast CPU/memory/pod saturation 7-30 days in advance. Instead of threshold-based alerts at 80%, teams receive advance warnings like: "CPU will reach cluster limit in 18 days based on current growth trend."
| Approach | Alert Timing | Response Mode | Risk Level |
|---|---|---|---|
| Manual | 80% threshold breach | Emergency node additions | Service disruption risk |
| Wave Autoscale | 18-day advance warning | Planned maintenance window expansion | Zero service risk |
PV Capacity Forecast
Analyzes storage growth patterns to forecast persistent volume exhaustion 2-4 weeks in advance.
| Approach | Alert Timing | Response Mode | Data Risk |
|---|---|---|---|
| Manual | Disk-full alert (after threshold) | Emergency storage expansion | Potential data loss |
| Wave Autoscale | 2-4 weeks advance warning | Auto-expansion or planned manual expansion | Zero data loss risk |
Memory Leak Detection
Detects memory leak patterns 6+ hours before OOM (Out of Memory) failures using ML regression analysis with statistical confidence scoring (R² threshold) to filter false positives.
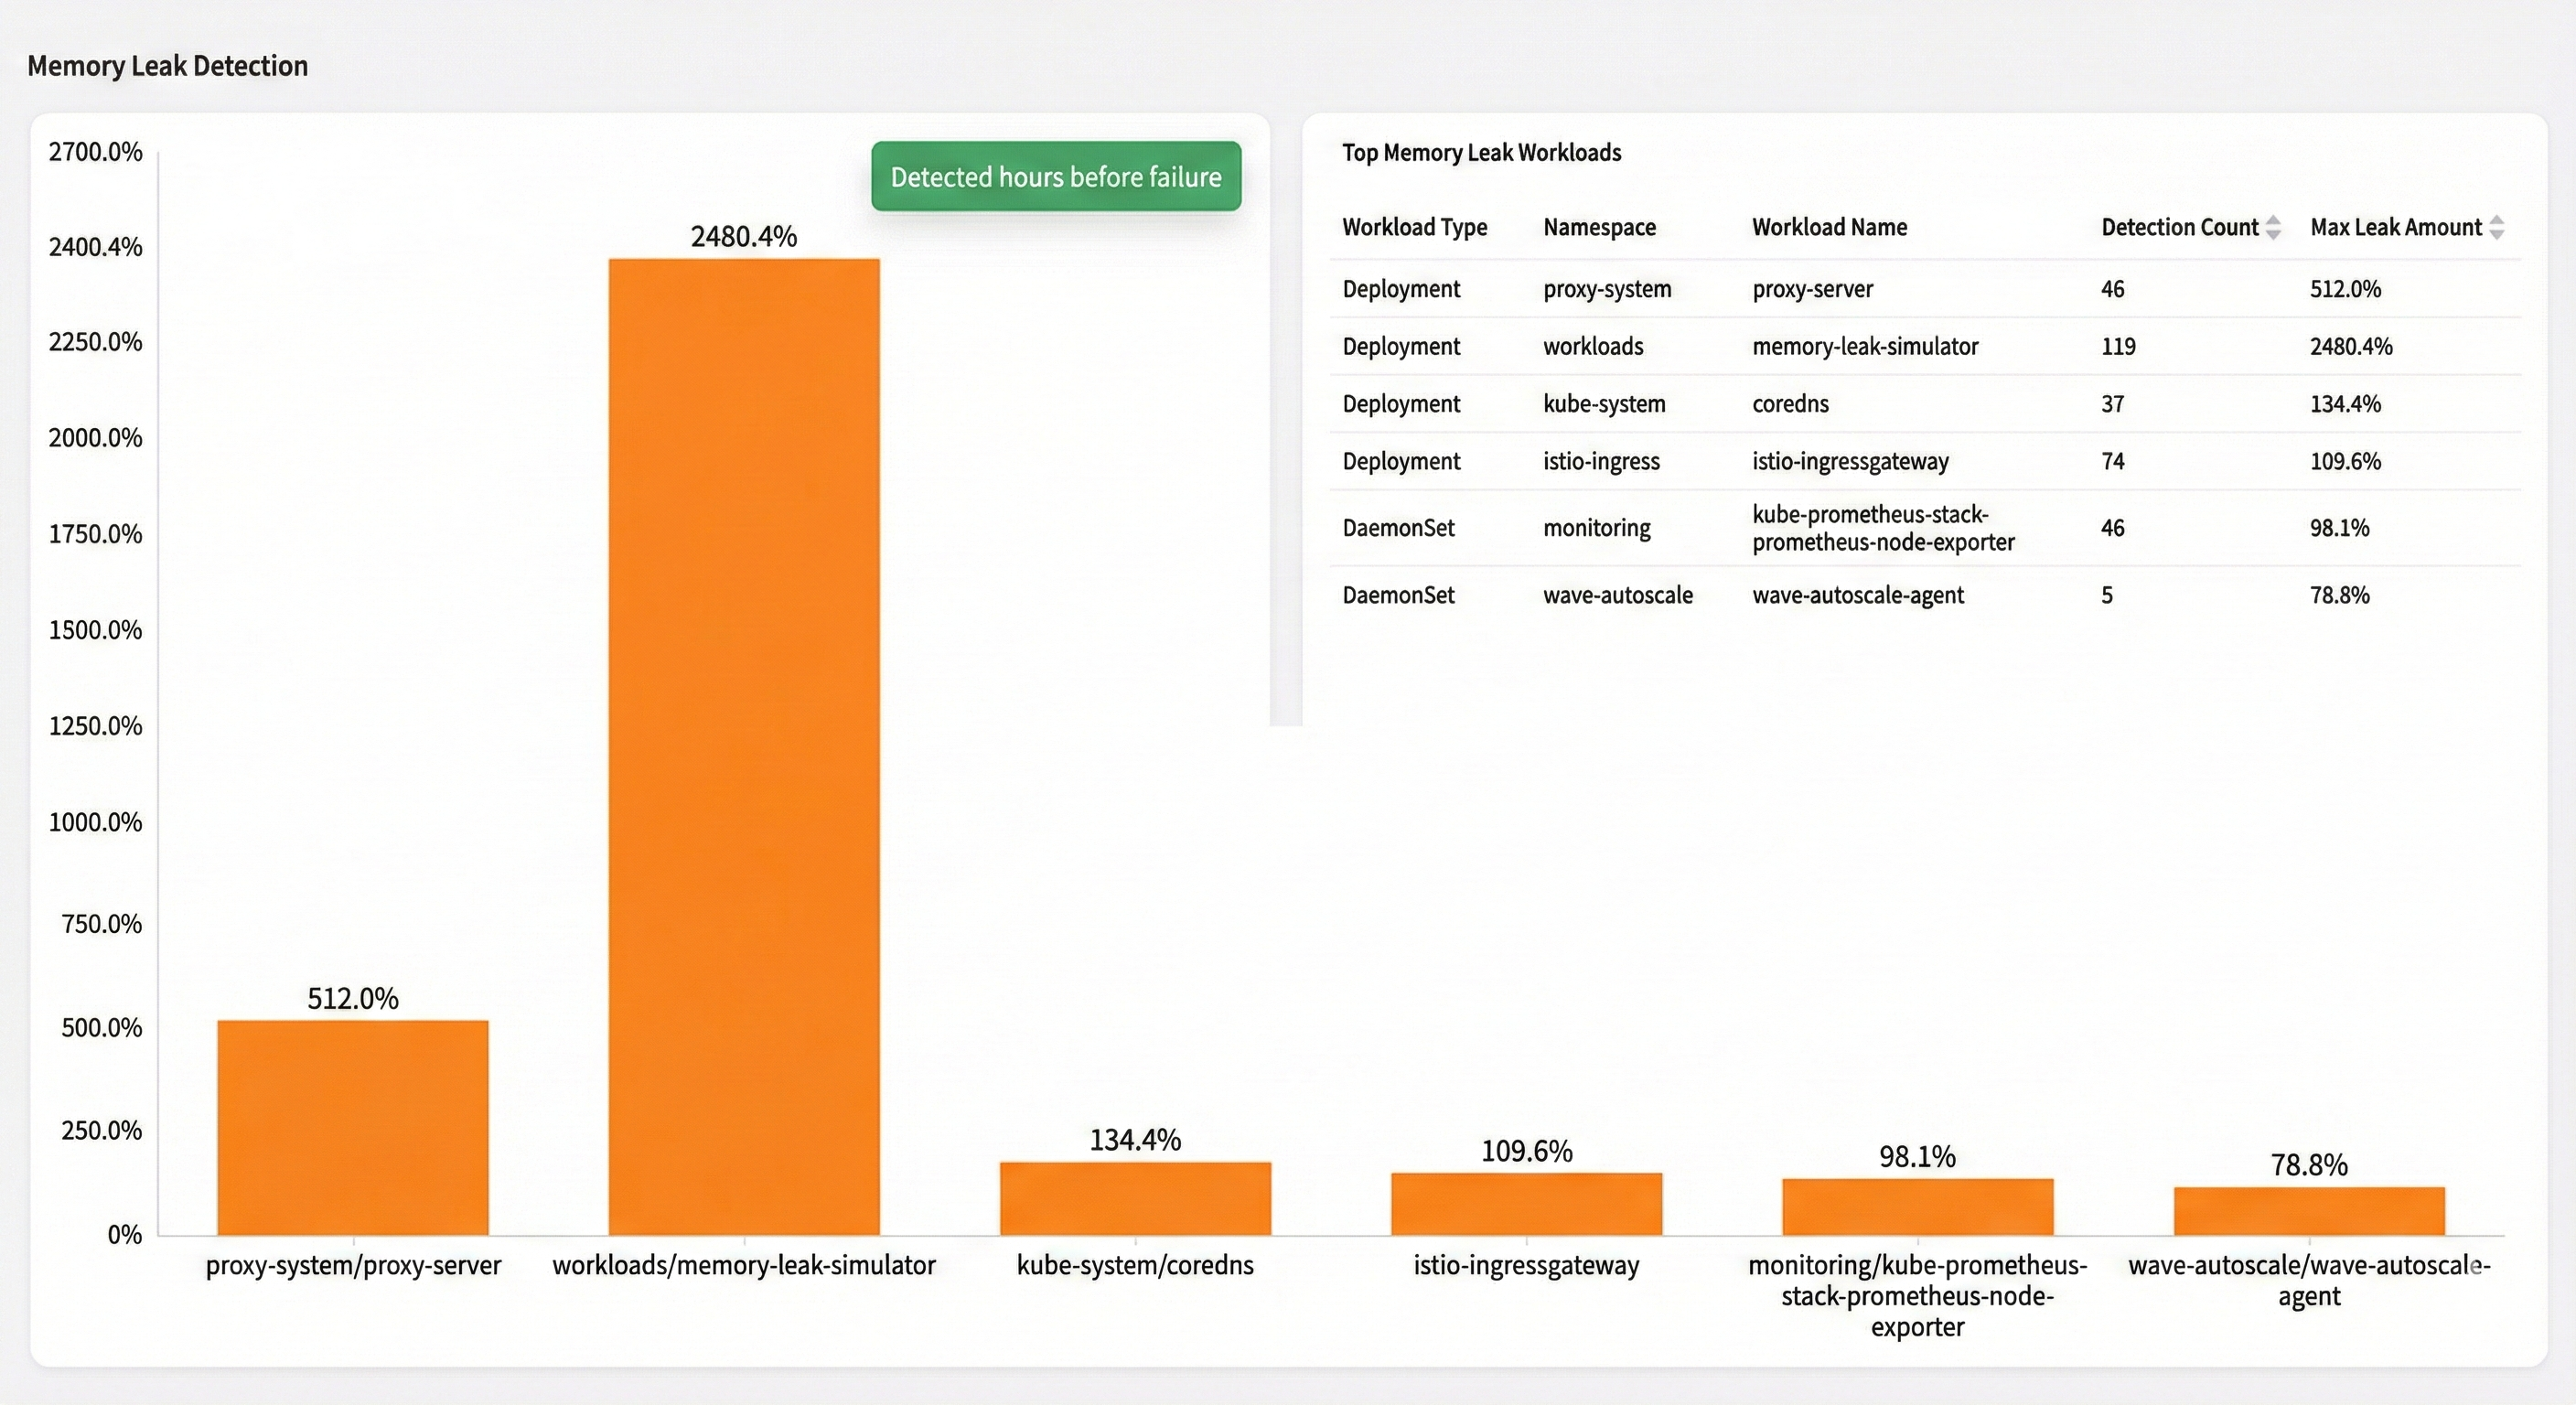
| Approach | Detection Timing | Investigation Window | Service Impact |
|---|---|---|---|
| Manual | After OOM occurs (midnight page) | Emergency investigation | Service downtime |
| Wave Autoscale | 6+ hours before OOM | Business hours investigation | Proactive pod restart, zero downtime |
Performance Insights: Automated Root Cause Analysis
CPU Utilization Analysis
Automatically categorizes ALL workloads by usage bands:
- <20%: Waste (over-provisioned)
- 20-60%: Optimal utilization
- 60-80%: Monitor closely
- >80%: Hotspot (under-provisioned)
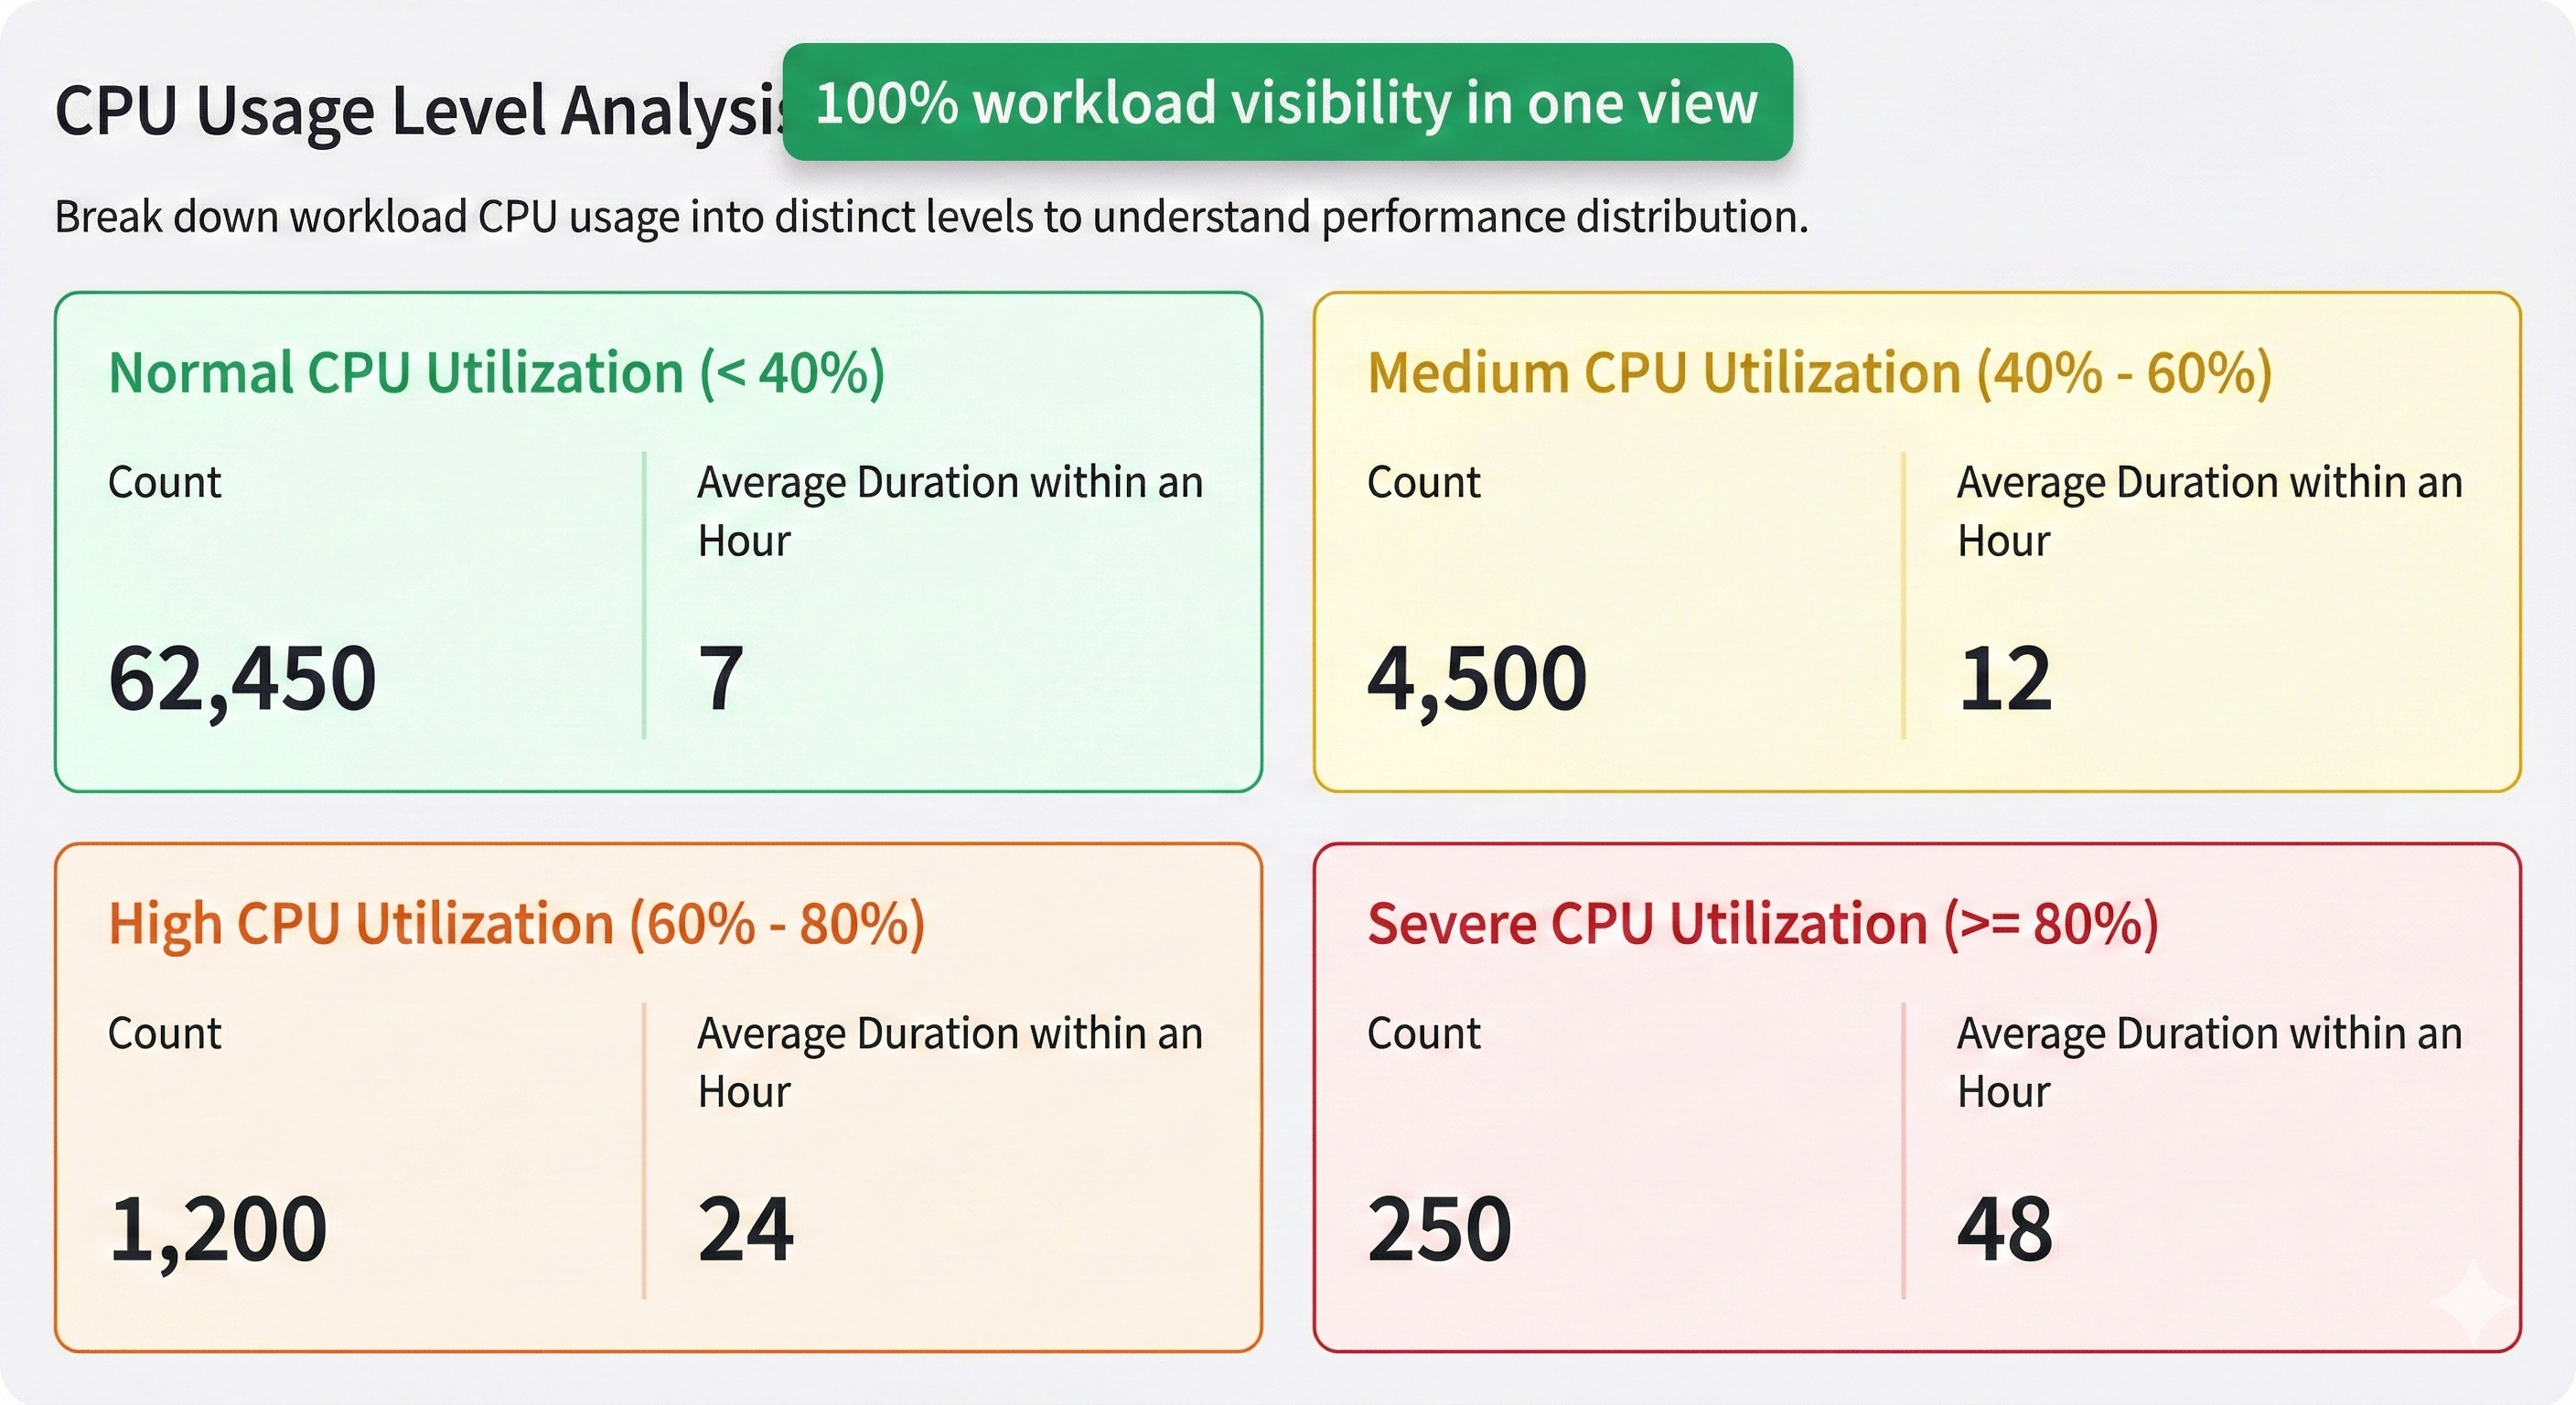
Addresses Brendan Gregg's critique: Goes beyond misleading CPU utilization percentages to include CPU Pressure (PSI) metrics, revealing when workloads are truly CPU-constrained vs. memory-stalled.
| Approach | Analysis Scope | Time Required | Team Accessibility |
|---|---|---|---|
| Manual | Check each service individually in Grafana | Hours of analysis | Requires tribal knowledge |
| Wave Autoscale | Complete visibility in one view | 90% faster | Accessible to all team members |
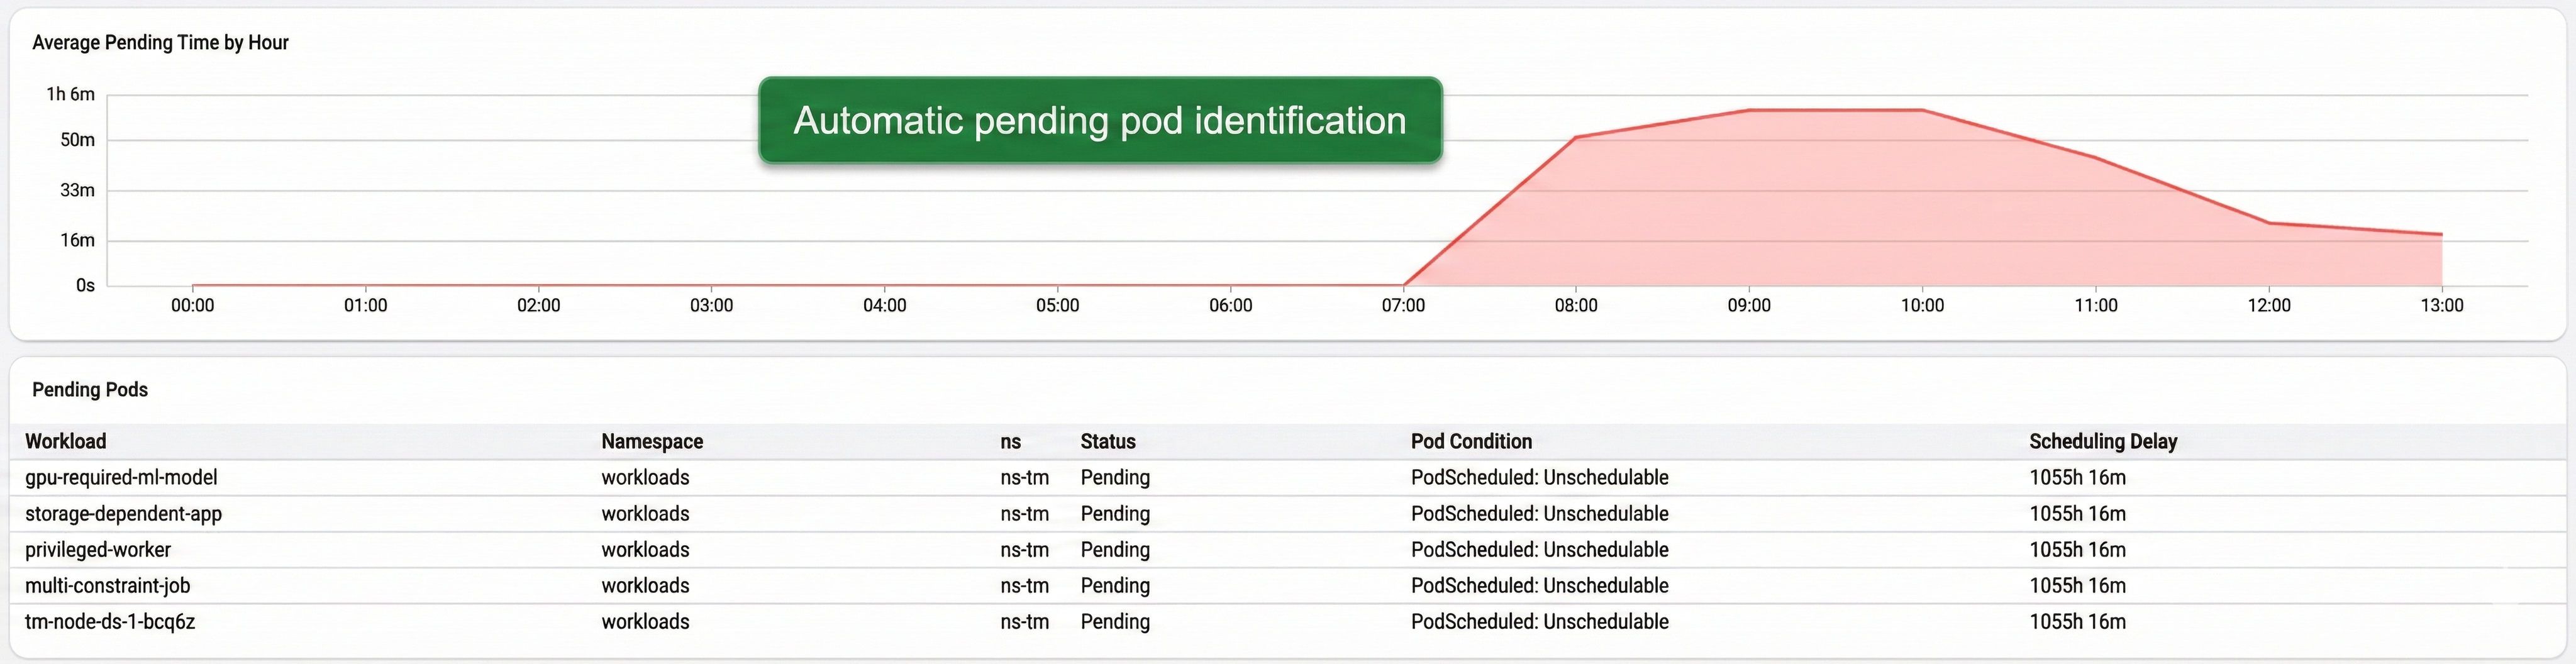
Pod Scheduling Delay Detection
Detects scheduling delays <1 minute after occurrence and identifies root cause automatically:
- Resource shortage (CPU/memory)
- Node constraints (taints, selectors)
- Affinity/anti-affinity misconfigurations
- PV availability issues
Cost Insights: Continuous Waste Detection
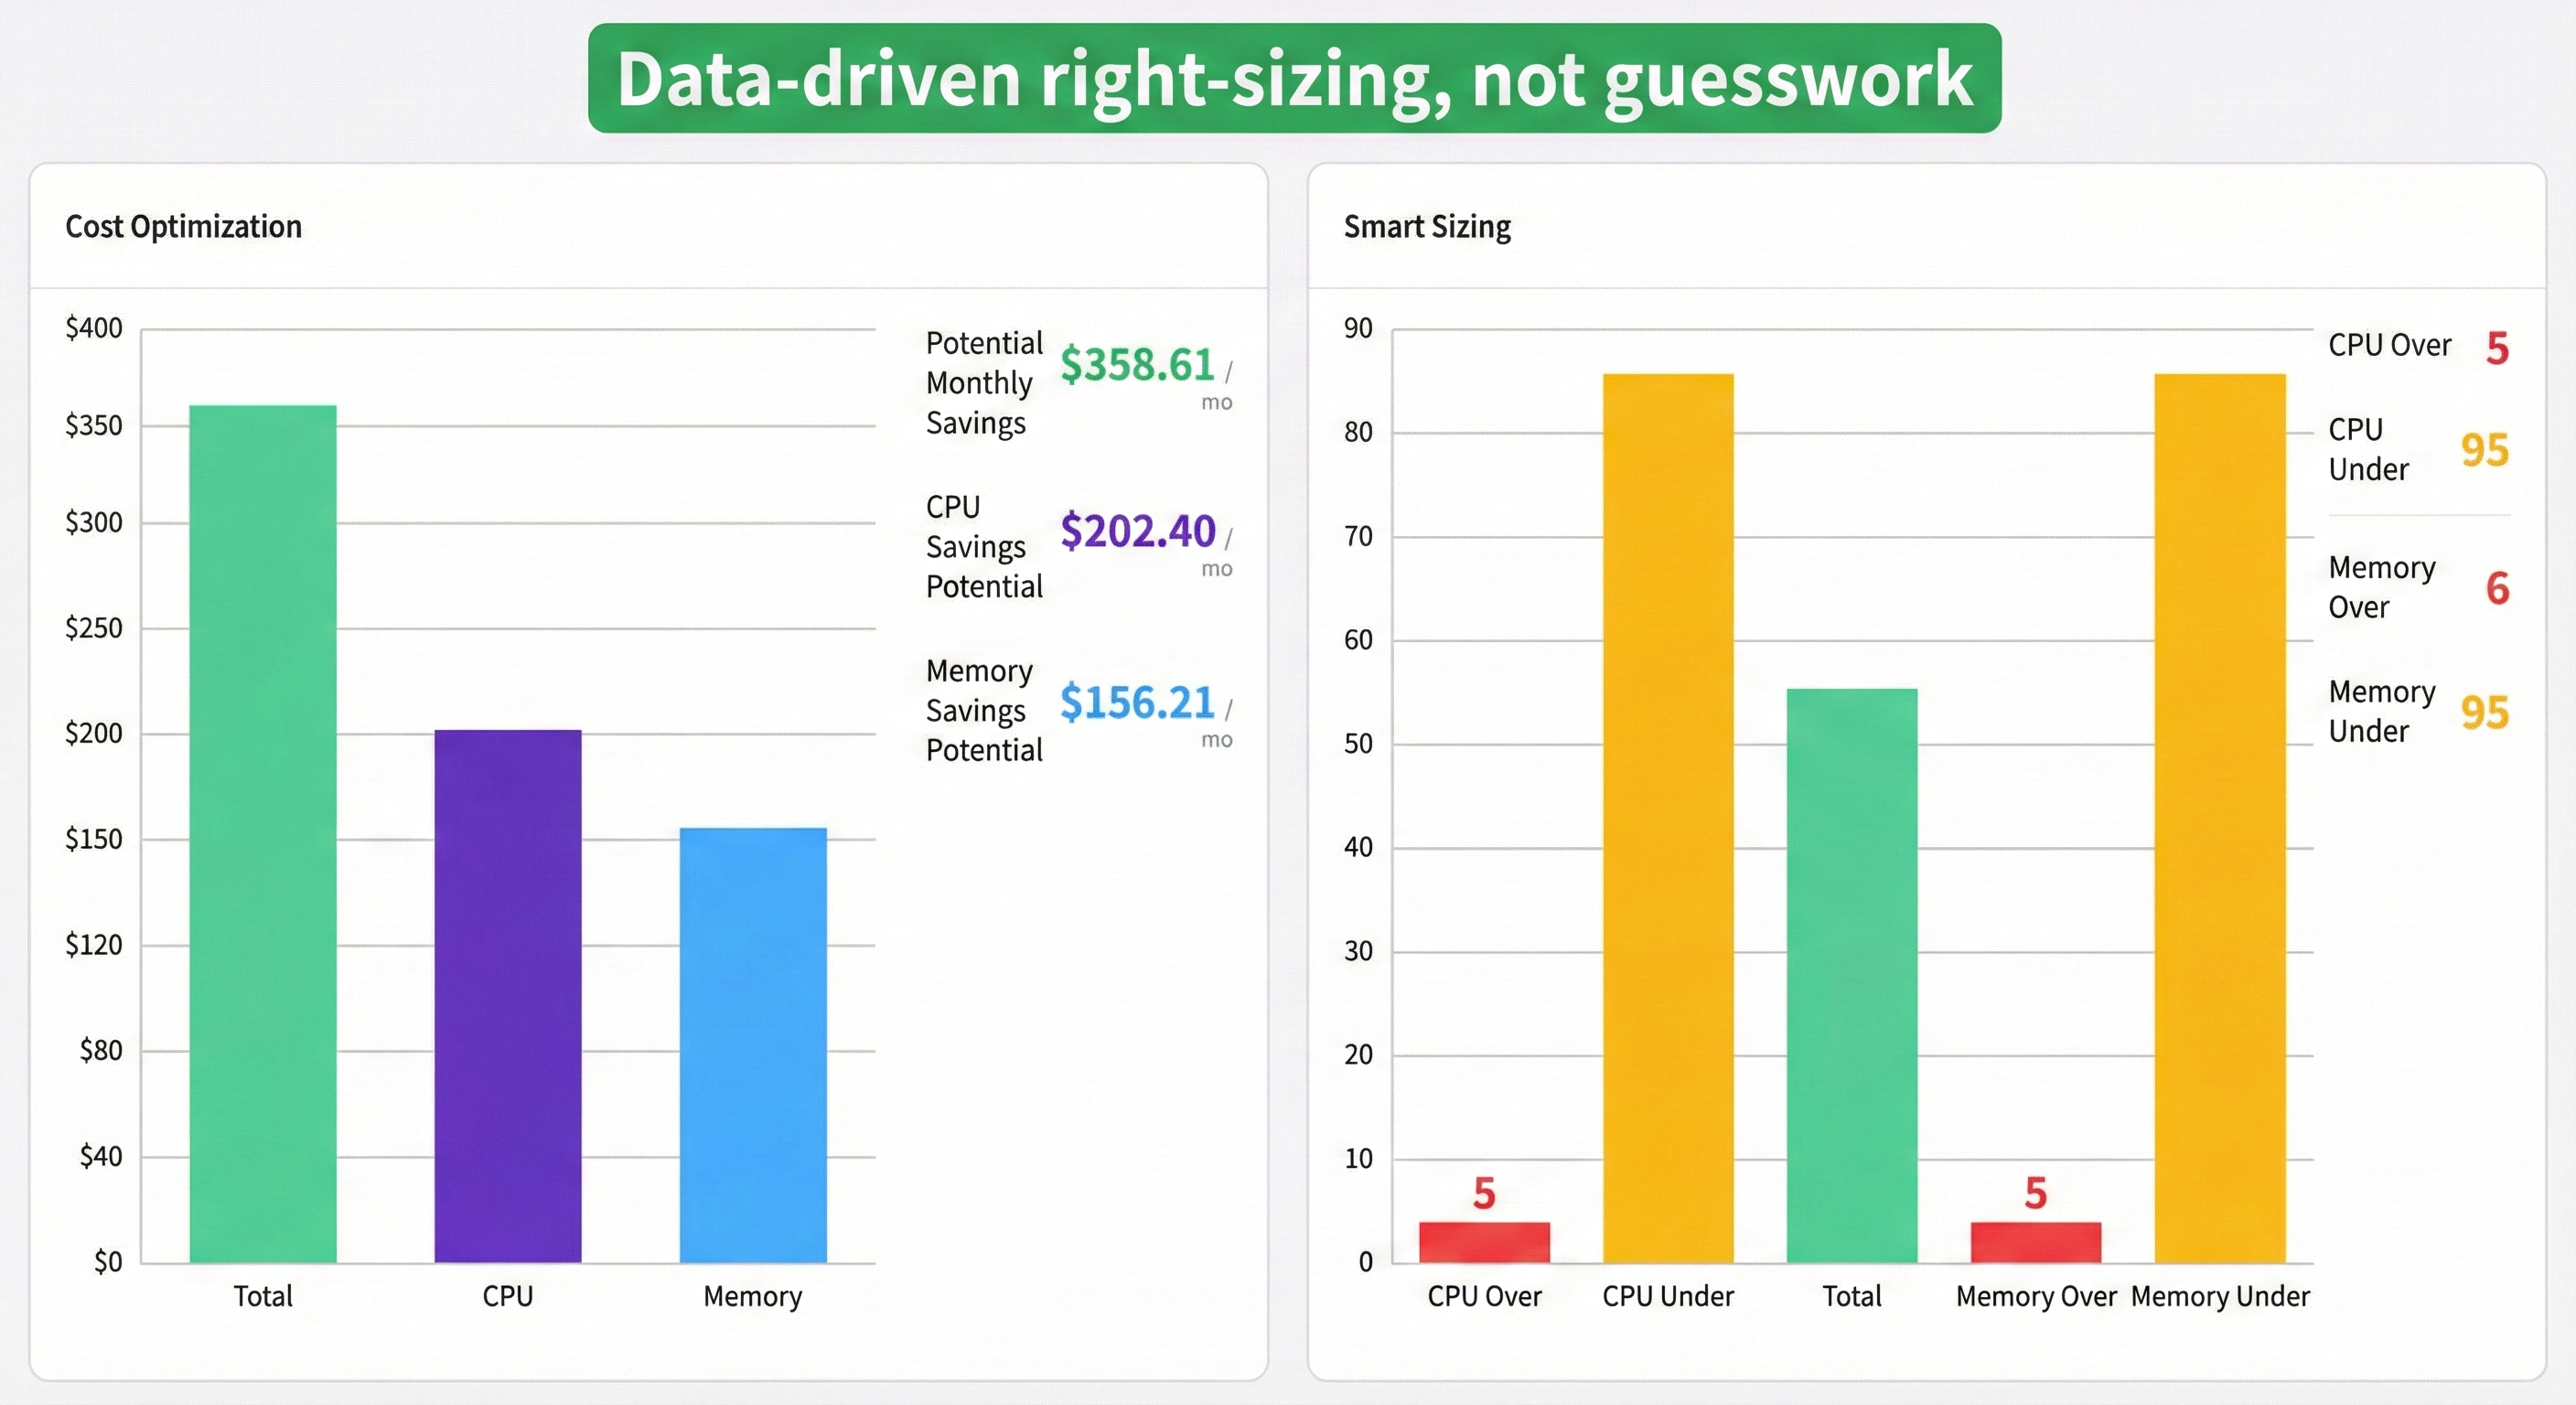
Smart Sizing Recommendations
Quantifies exact resource waste with specific CPU/memory recommendations based on P95/P99 actual usage vs. requested resources.
Addresses the over-provisioning problem: Recall that Datadog's research (opens in a new tab) found 49% of containers use <30% of their requested CPU. Smart Sizing identifies this waste and provides actionable recommendations with confidence scores.
| Approach | Analysis Process | Time Investment | Optimization Frequency |
|---|---|---|---|
| Manual | 6-step rightsizing cycle | 25-100 hours/month | Quarterly |
| Wave Autoscale | Continuous automated analysis | 95% time reduction | Continuous with instant recommendations |
Idle Node Detection
Continuously identifies nodes running only DaemonSets (monitoring agents, CNI plugins) with no application workloads. Provides exact cost calculations for wasted infrastructure.
| Approach | Detection Frequency | Waste Duration | Cost Impact |
|---|---|---|---|
| Manual | Quarterly audits with manual inspection | Orphaned nodes unnoticed for months | Ongoing waste accumulation |
| Wave Autoscale | Real-time continuous detection | Immediate notification and safe removal | 10-20% infrastructure cost reduction |
Unused PV Detection
Identifies orphaned persistent volumes (Released, Failed, or unbound states) with cost calculations based on storage class pricing.
| Approach | Visibility | Waste Detection | Cleanup Process |
|---|---|---|---|
| Manual | No visibility, costs climb unexpectedly | TB-scale waste accumulates unnoticed | Manual identification and deletion |
| Wave Autoscale | Automatic detection with cost quantification | Immediate identification | Safe automated cleanup via PV Cleanup action |
The Fundamental Shift
Wave Autoscale represents a transformation in how teams use Kubernetes metrics:
- From "staring at dashboards" → to "receiving actionable insights"
- From "responding after 80% threshold breach" → to "planning weeks in advance"
- From "6-step manual rightsizing cycle" → to "one-click application of recommendations"
- From "tribal knowledge vulnerable to turnover" → to "institutional knowledge encoded in automation"
- From "quarterly optimization exercises" → to "continuous waste detection"
Real-World Impact
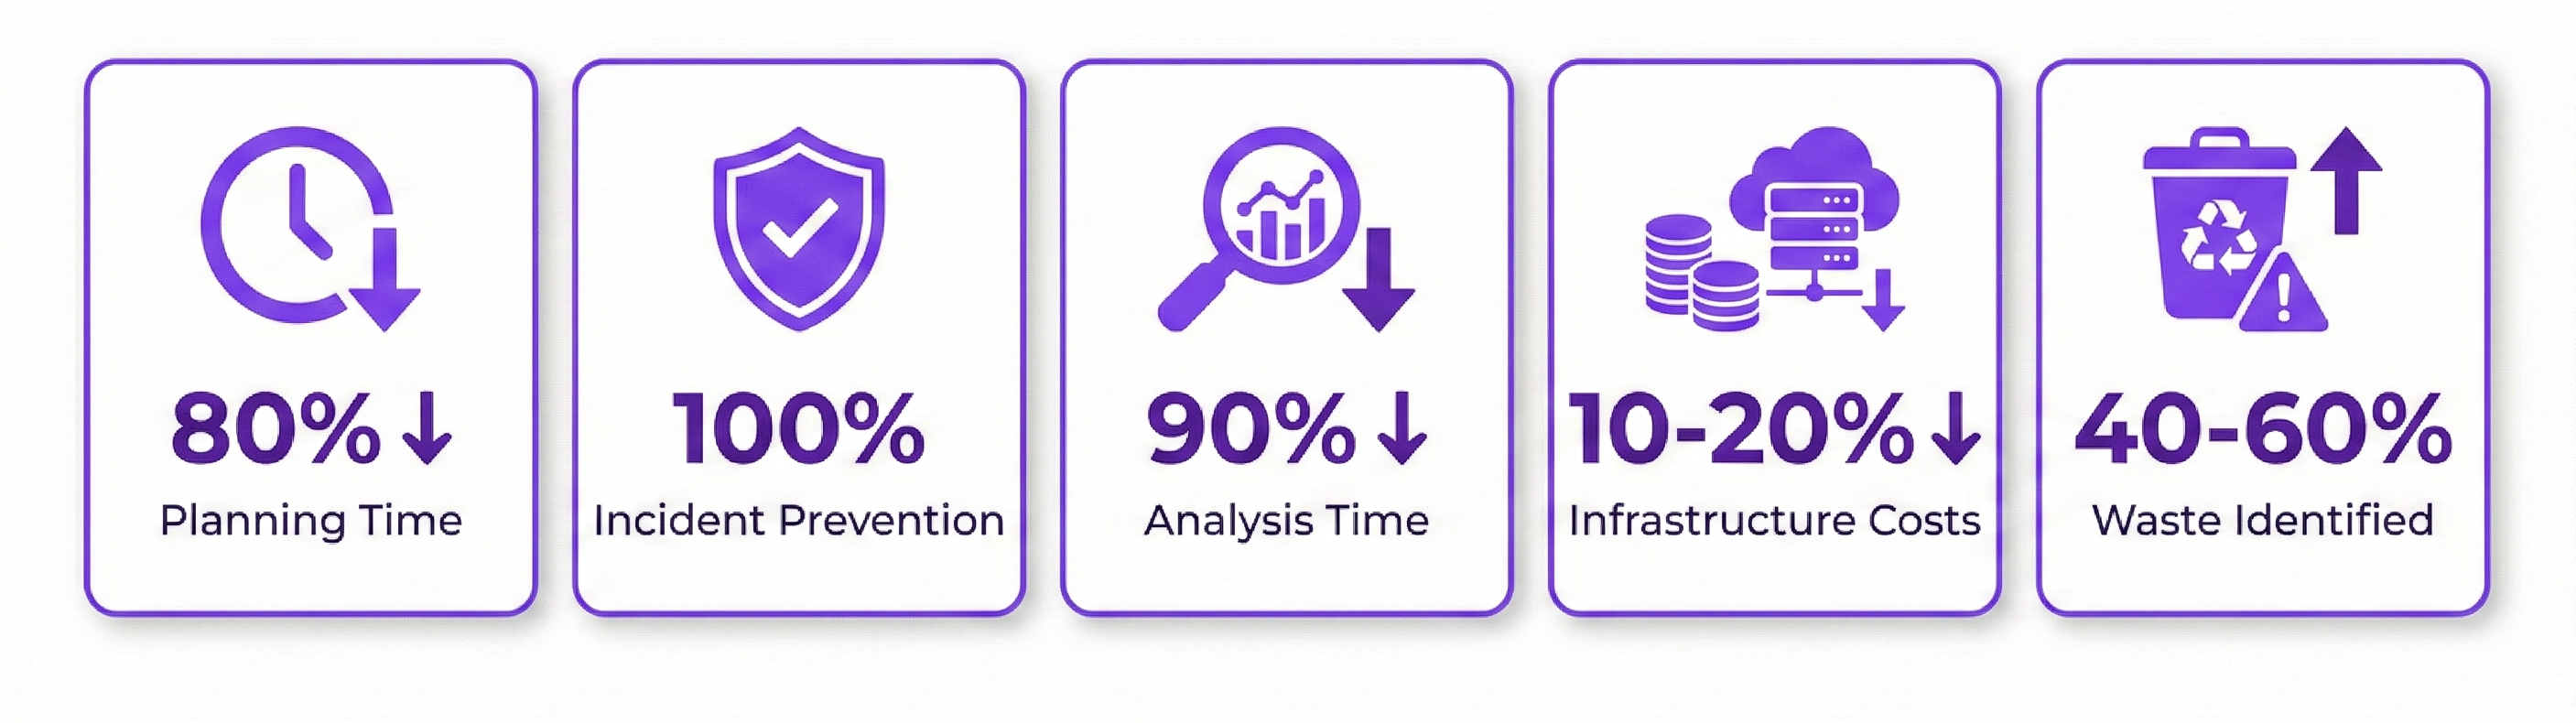
| Impact Category | Metric | Result |
|---|---|---|
| Time Savings | Capacity planning | 80% reduction |
| Resource utilization analysis | 90% faster | |
| Right-sizing analysis | 95% time reduction | |
| Reliability | Capacity-related outages | 100% prevention (saturation/OOM/disk-full) |
| Incident response | 80% faster troubleshooting | |
| Advance warning | 7-30 days before issues | |
| Cost Optimization | Infrastructure waste | 10-20% cost reduction |
| Storage waste | 15-25% cost savings | |
| Resource waste identified | 40-60% with quantified impact | |
| Team Efficiency | Engineering toil | 30-100% reduction |
| Dashboard/alert fatigue | Eliminated | |
| Knowledge transfer | Accessible to all team members |
Key Benefits:
For Engineering Managers: Increased feature velocity, data-backed justification for optimization projects, higher SLAs with fewer midnight pages
For Platform Teams: Predictable capacity planning during maintenance windows, automatic root cause analysis, insights accessible to junior and senior engineers alike
Conclusion: The Evolution of Kubernetes Operations
The industry is evolving through three stages:
- Threshold-Based Monitoring: 80% alerts, after-the-fact responses, 30-100% time on manual work
- Manual Trend Analysis: Spreadsheet exports, manual P95/P99 calculations, 25-100 hours monthly
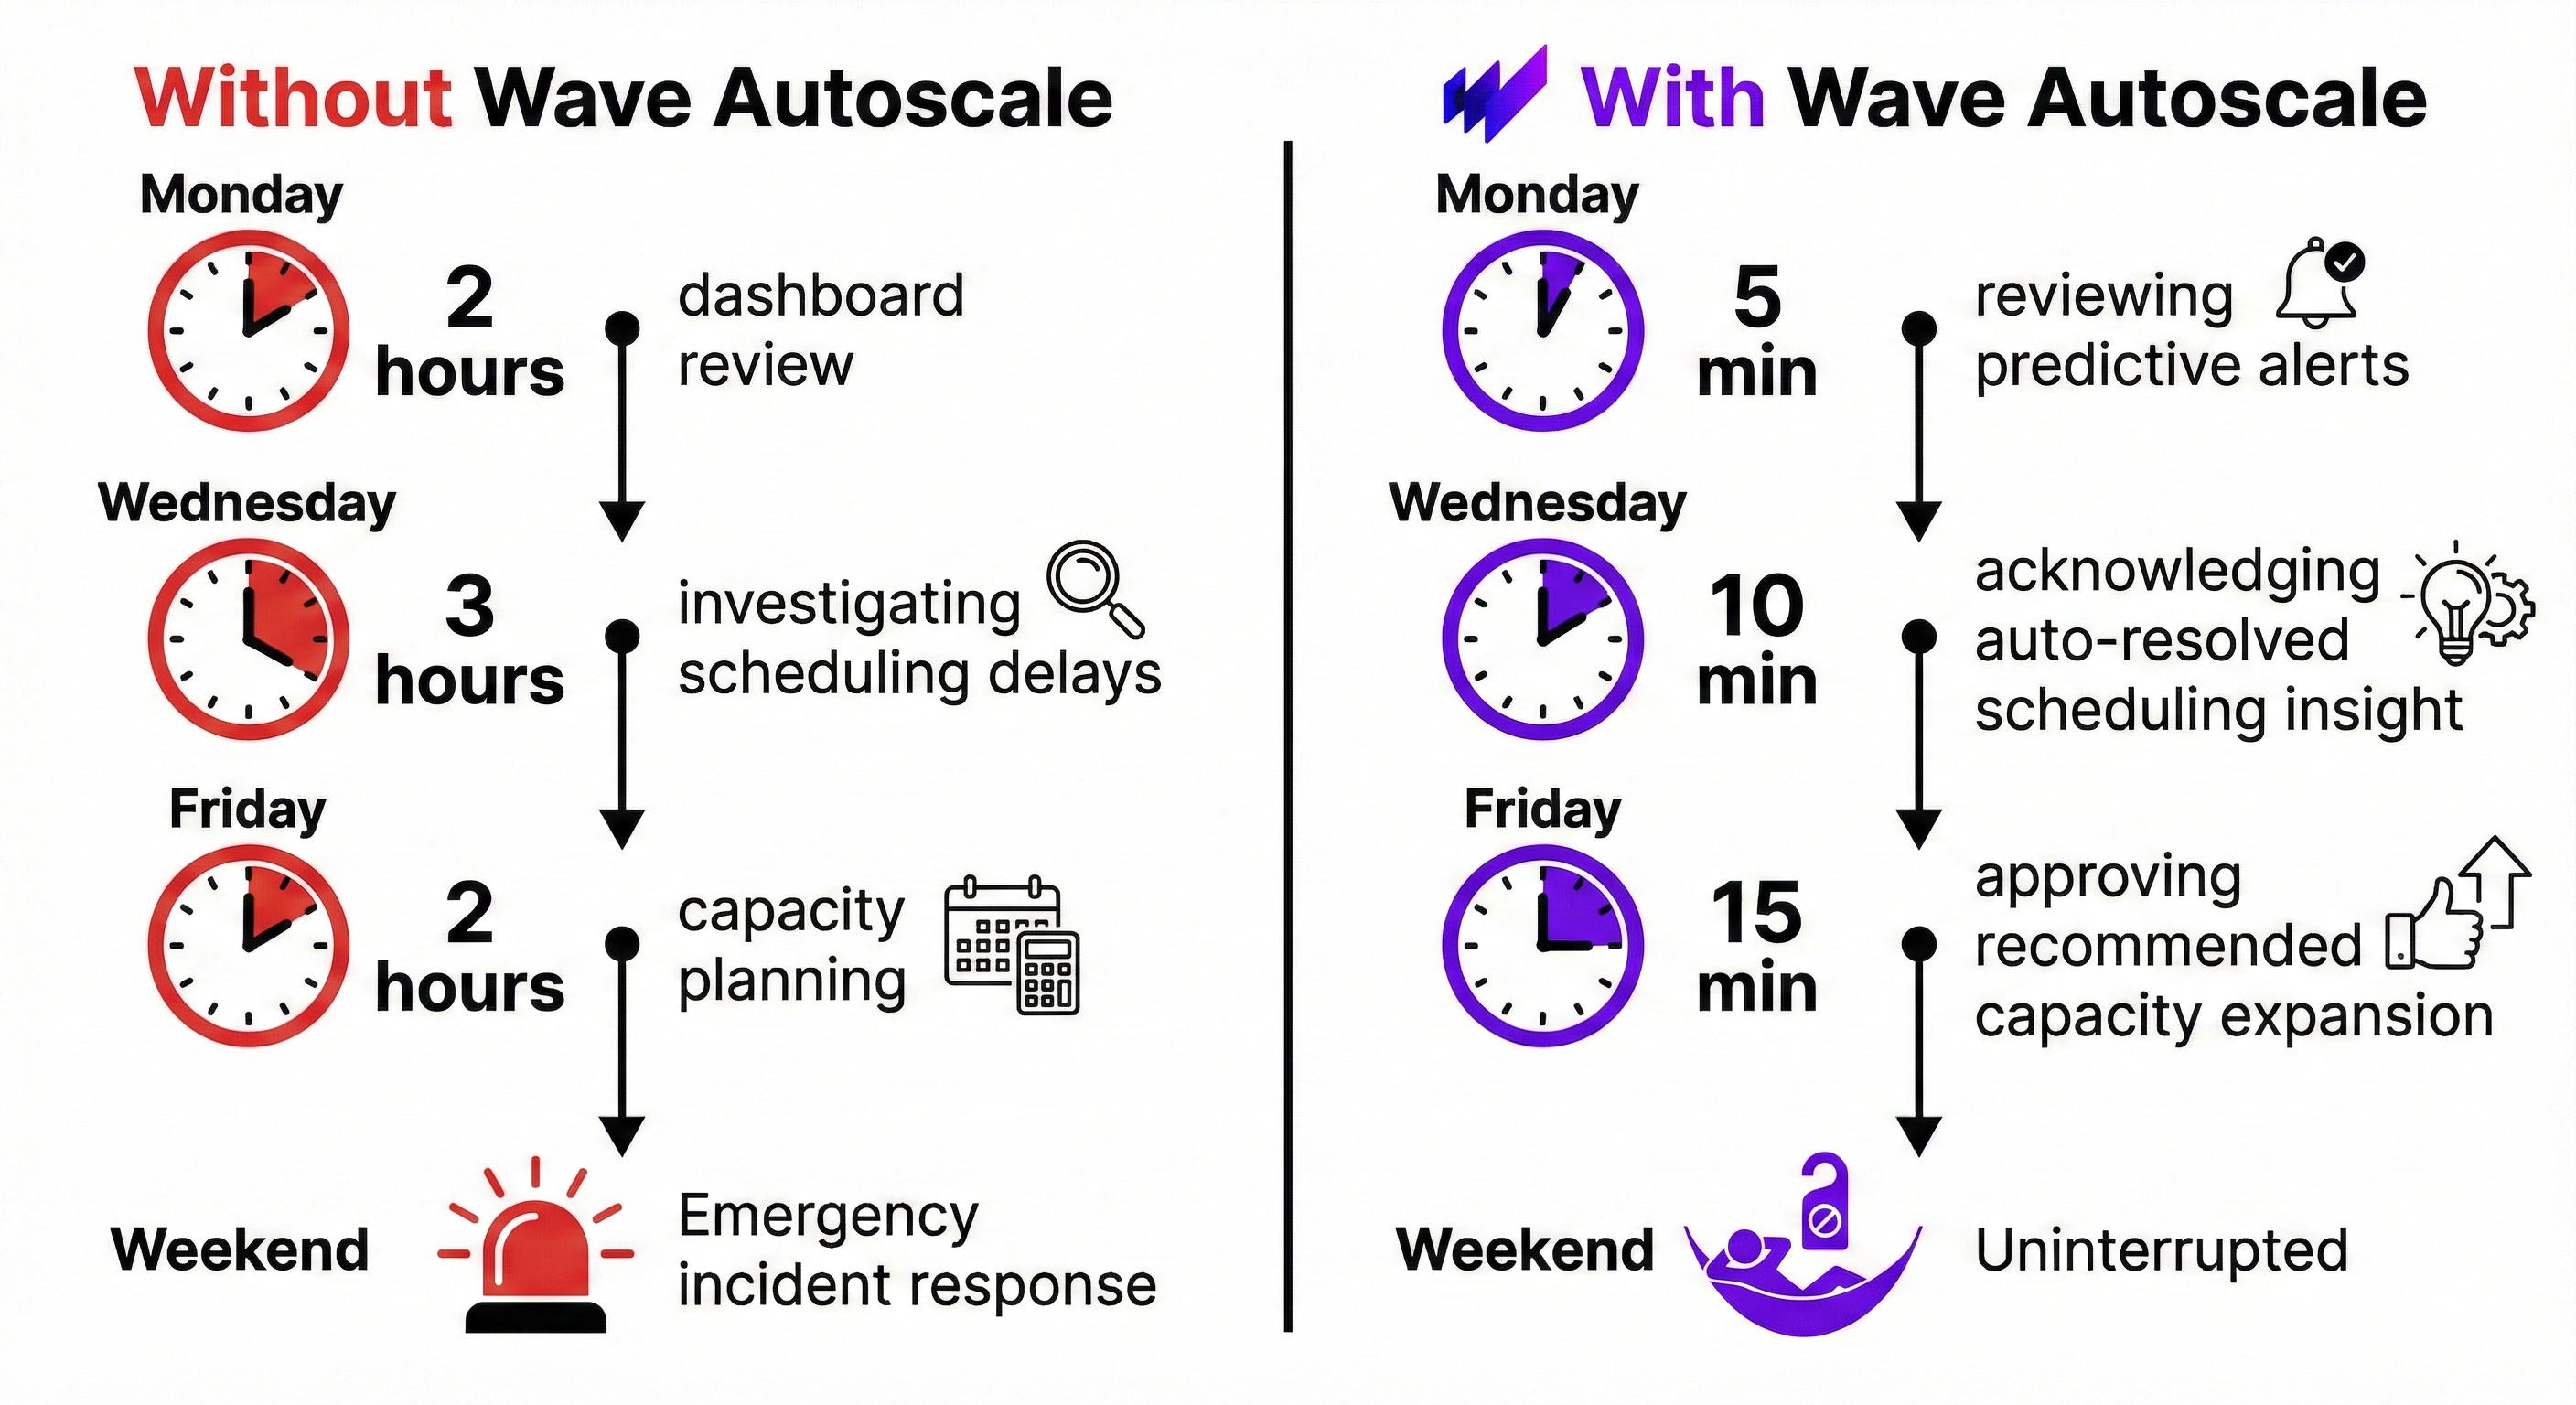
- Automated Intelligence: Continuous analysis, 7-30 day advance warnings, automatic root cause, instant recommendations
The Research Tells the Story
The data from industry leaders makes the case clear:
- 30-100% of time on manual toil (Catchpoint SRE Report 2023 (opens in a new tab))
- 49% see cost increases after K8s adoption, 70% cite over-provisioning (CNCF FinOps Microsurvey 2023 (opens in a new tab))
- 49% of containers use <30% requested CPU (Datadog Container Report 2020 (opens in a new tab))
- 40% found configuration errors (Red Hat Security Report 2024 (opens in a new tab))
- CPU utilization misleads capacity decisions (Brendan Gregg (opens in a new tab))
- 42% knowledge loss with staff turnover (CISIN Knowledge Transfer Study (opens in a new tab))
Wave Autoscale doesn't replace your observability stack — it transforms the raw metrics your team was spending hours compiling manually into actionable intelligence.
The question isn't whether your team has access to Kubernetes data. The question is: how much engineering time are you spending to turn that data into decisions?
Get Started with Wave Autoscale
Ready to transform your Kubernetes operations from manual analysis to automated intelligence?
Explore Wave Autoscale Insights features:
- Cluster Resource Forecast — 7-30 day advance capacity warnings
- PV Capacity Forecast — Prevent storage outages with predictive capacity planning
- Memory Leak Detection — 6+ hour early OOM detection
- CPU Utilization Analysis — Complete workload visibility
- Pod Scheduling Delay Detection — Automatic root cause analysis
- Smart Sizing Recommendations — Data-driven rightsizing
- Idle Node Detection — Real-time infrastructure waste detection
- Unused PV Detection — Storage cost reclamation
Learn more:
- Visit Wave Autoscale (opens in a new tab)
- Contact us to see a demo