What is "Smart Sizing" for Smarter Clouds: The Next Step Beyond Rightsizing
Author: Thomas Mathew (opens in a new tab) Date: December 31, 2025
TL;DR: Kubernetes clusters typically waste 30–40 percent of resources due to oversized CPU and memory requests. Developers over-allocate to avoid performance issues, resulting in massive unused compute. Manual rightsizing requires continuous analysis across hundreds of workloads. Kubernetes VPA automates part of this but has critical limitations. Wave Autoscale's Smart Sizing solves these gaps with better metrics, actionable recommendations, and unified vertical + horizontal scaling.
Key Takeaways
- Kubernetes clusters typically waste 30–40 percent of resources due to oversized CPU and memory requests
- Developers over-allocate resources to avoid performance issues, resulting in large amounts of unused compute
- Manual rightsizing requires continuous metric analysis, classification, and adjustments
- Kubernetes VPA automates part of the problem but has known limitations
- Wave Autoscale resolves these gaps with better metrics, actionable recommendations, and unified scaling
Why Kubernetes Clusters Waste So Much
Your Kubernetes clusters are probably wasting 30-40% of resources right now, and your engineers are wasting hours trying to fix it. Datadog's 2020 container research shows: (opens in a new tab) nearly half of containers use less than a third of their requested CPU and memory.
This is not intentional. Developers request more than they need:
- request 500m CPU when 200m is enough
- ask for 1Gi memory when 400Mi would work
This "just in case" buffer prevents outages, but across hundreds of workloads, the waste compounds.
Engineers spend hours optimizing these values manually, time that is lost whenever workload behavior changes.
The Goldilocks Zone
A container is considered well-provisioned when:
- actual usage is between 90–110% of its requested resources
- below 90% → wasting compute
- above 110% → risking performance
This guide explains how to right-size containers correctly, and why automation becomes essential at scale.
Manual Rightsizing: The Complete Process
Manual rightsizing can work, but it requires time, skill, and repeated cycles.
Step 1: Collect the Right Metrics
Sysdig's capacity planning guide (opens in a new tab) recommends using kube-state-metrics and cAdvisor to analyze resource utilization across containers and namespaces.
- Gather at least 7-14 days of continuous metrics data
- Required metrics: CPU utilization, memory usage, network I/O
- Tools: Prometheus, CloudWatch, Datadog
- Someone needs to set up the dashboards and queries
Challenge: Different workloads need different observation windows. A batch job that runs weekly looks very different from an API that handles traffic 24/7.
Step 2: Analyze Historical Patterns
- Identify peak usage periods
- Account for daily and weekly cycles
- Separate genuine patterns from anomalies
- That spike last Tuesday, is it a real traffic surge or one-time data migration?
Challenge: Requires statistical analysis skills that not every team has readily available.
Step 3: Classify Each Workload
For every container, determine its provisioning state:
- Over-provisioned: Actual usage < 90% of request → wasting money
- Under-provisioned: Actual usage > 110% of request → risking performance
- Well-provisioned: Usage within 90-110% of request → just right
Challenge: For hundreds of containers, classification in itself takes days to complete.
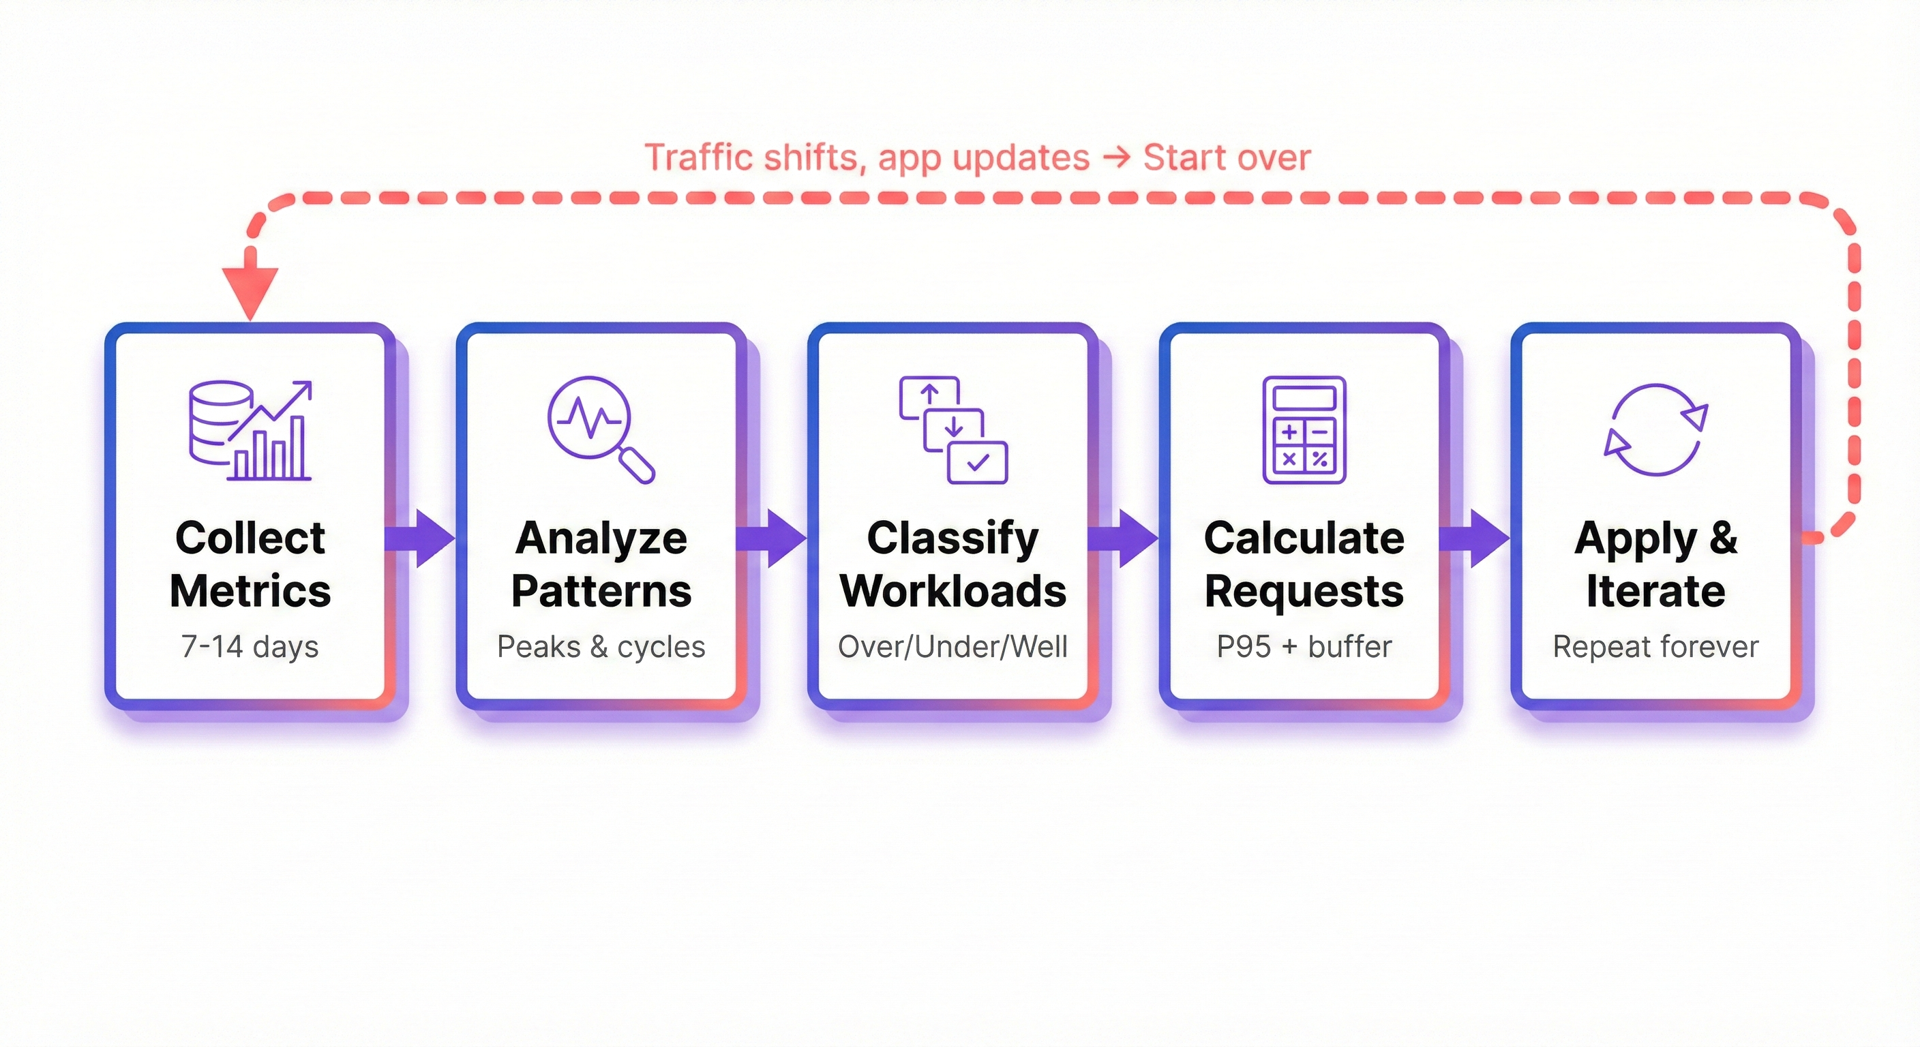
Step 4: Calculate Optimal Requests
- Start with P95 (95th percentile) usage
- Add buffer for headroom
- Consider burst patterns and traffic spikes
- Account for garbage collection overhead
- Factor in startup resource spikes
Challenge: Different workload types like web servers, databases, batch processors all need different formulas.
Example Formula:
Recommended CPU Request = (P95 CPU Usage × Burst Multiplier) + Startup Overhead
Recommended Memory Request = Max Memory Usage + GC Overhead + Safety Buffer
Step 5: Apply Changes and Iterate
- Roll out changes carefully with monitoring
- Have a rollback plan ready
- Watch for performance regression
- Traffic patterns shift → repeat the process
- Application updates → repeat the process
Challenge: This never ends.
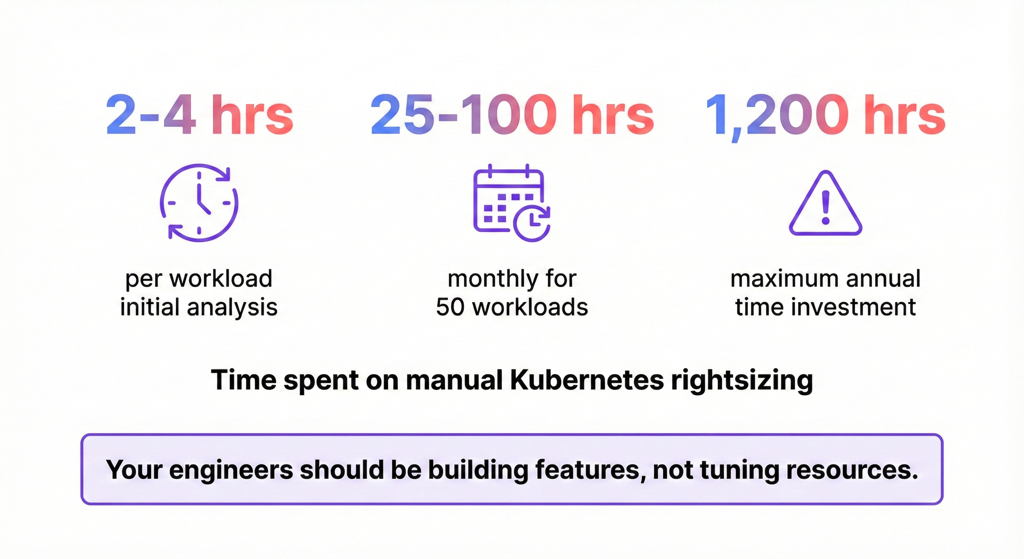
The Man-Hours Reality
Vertical Pod Autoscaler (VPA): A Step Forward
The Kubernetes sig-autoscaling community developed the Vertical Pod Autoscaler (VPA) to tackle this problem.
Reference: The project was originally designed by engineers at Google (opens in a new tab) and remains actively maintained by contributors from Google, Microsoft, and others (opens in a new tab).
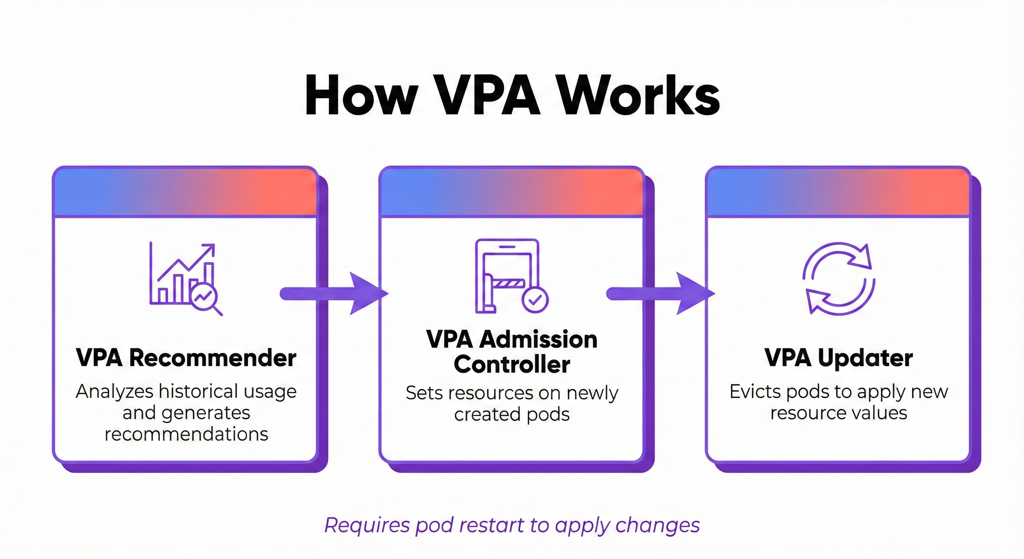
VPA monitors your containers' actual resource usage and automatically adjusts requests and limits based on observed patterns. Instead of engineers manually analyzing metrics and calculating optimal values, VPA does it for you.
What VPA Does Well
- Automatic recommendations: Analyzes historical usage and suggests optimal CPU/memory requests
- Continuous adjustment: Adapts to changing workload patterns over time
- Reduces manual effort: No more spreadsheet analysis or PromQL queries
- Three operating modes:
- Off: Only provides recommendations (you apply manually)
- Initial: Sets resources only at pod creation
- Auto: Actively updates running pods (requires pod restart)
A Genuine Improvement
For teams drowning in manual rightsizing work, VPA is a real step forward. It removes the burden of:
- Collecting and analyzing weeks of metrics data
- Calculating P95 values and buffer multipliers
- Classifying each workload individually
Reference: The Kubernetes documentation (opens in a new tab) describes VPA as a solution for "automatically adjusting the CPU and memory reservations for your Pods to help 'right size' your applications."
If VPA solved everything, our article would end here.
VPA's Key Limitations
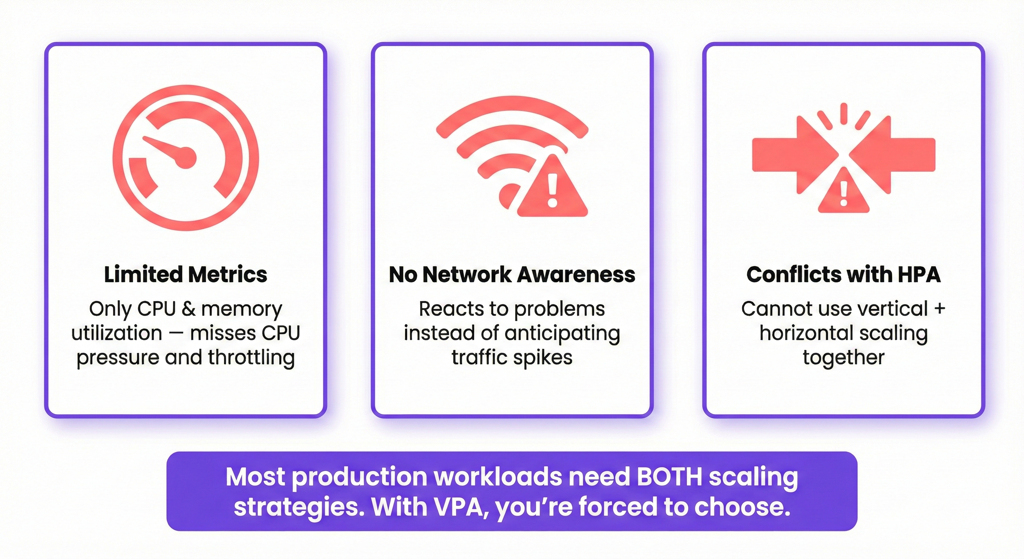
1. Limited Metrics
VPA uses CPU and memory utilization, which do not reflect real contention. Containers can show 50 percent CPU even when throttled.
CPU Pressure (PSI) (opens in a new tab) is the correct signal to detect impending performance degradation.
Reference: Brendan Gregg - CPU Utilization is Wrong (opens in a new tab)
2. No Network Awareness
Network I/O spikes often occur before CPU and memory spikes.
VPA cannot anticipate these patterns.
3. Cannot Work with HPA
VPA and HPA both modify pod specs, they conflict. The VPA documentation (opens in a new tab) explicitly warns against using both together.
Wave Autoscale: The Complete Solution
Wave Autoscale addresses every VPA limitation with a different approach.
Better Metrics = Better Recommendations
Wave Autoscale uses:
- CPU pressure metrics (actual contention, not just utilization)
- Network I/O metrics as leading indicators
- Traffic-aware sizing so the system predicts resource needs
This allows proactive sizing rather than reactive adjustments.
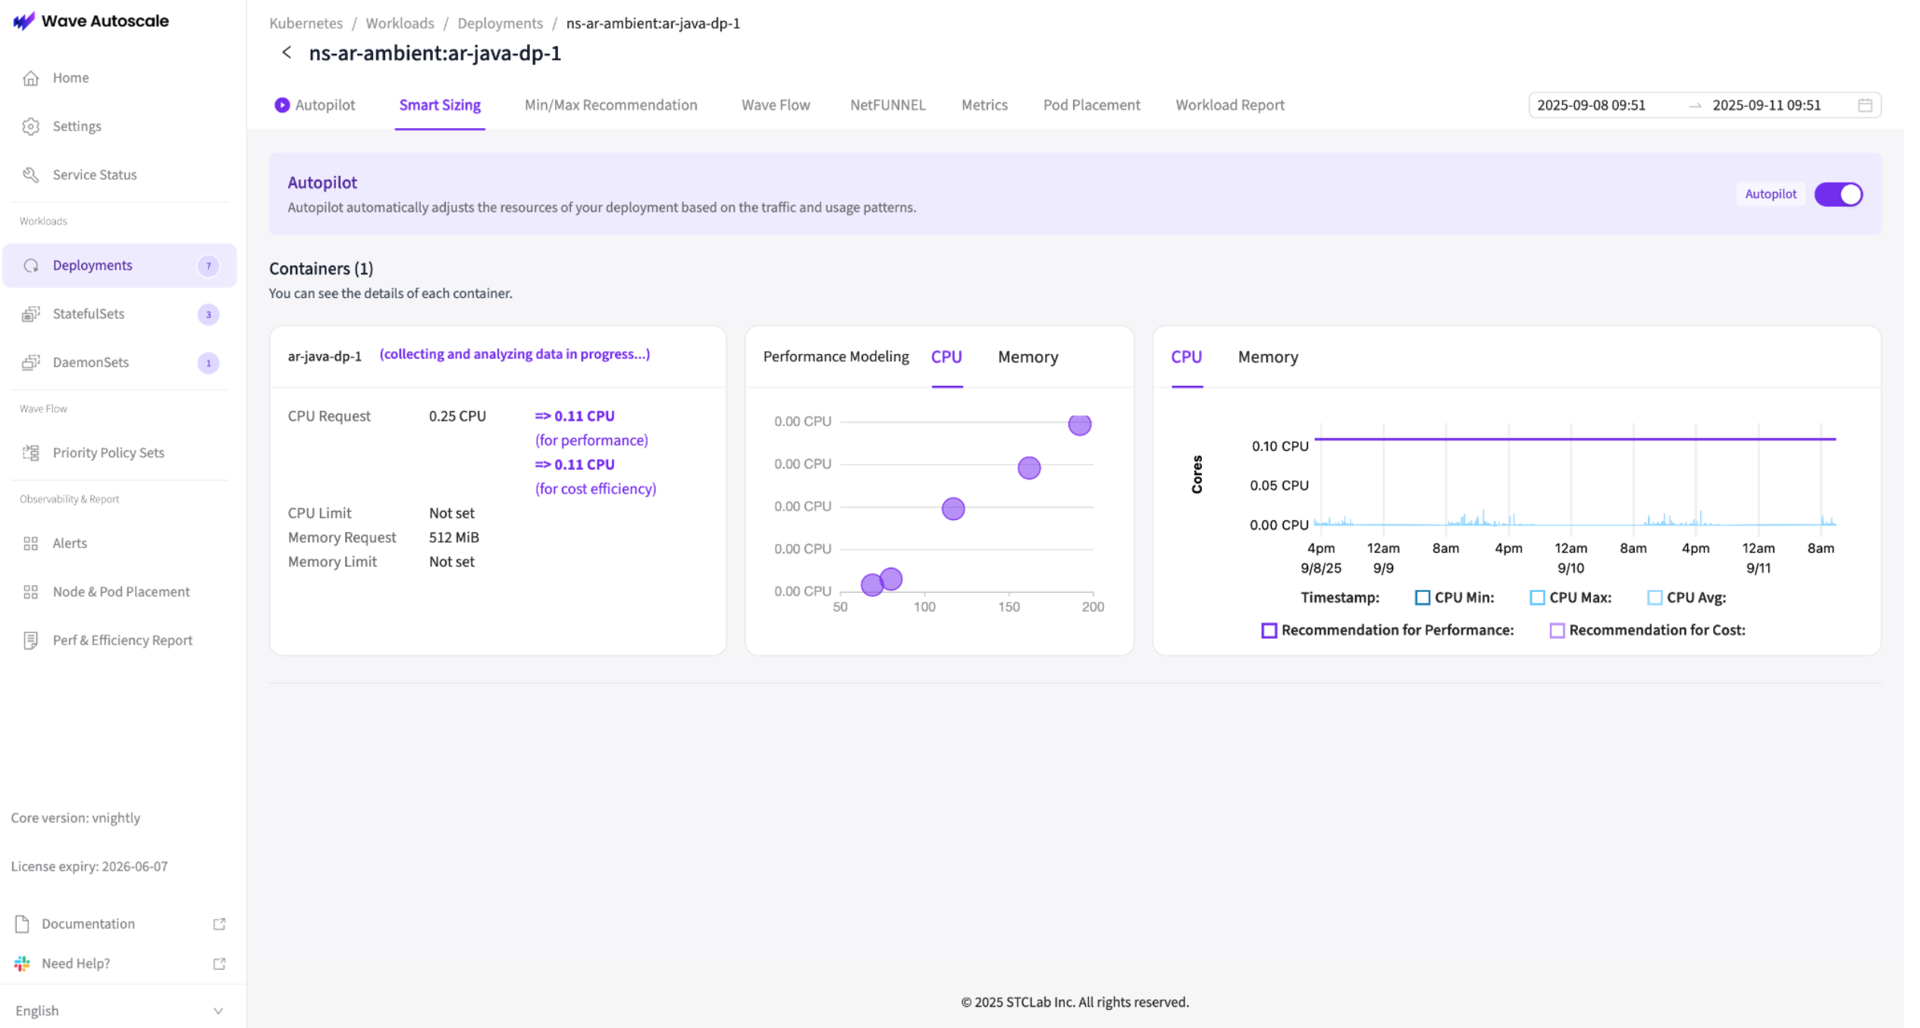
Actionable Recommendations with Smart Sizing
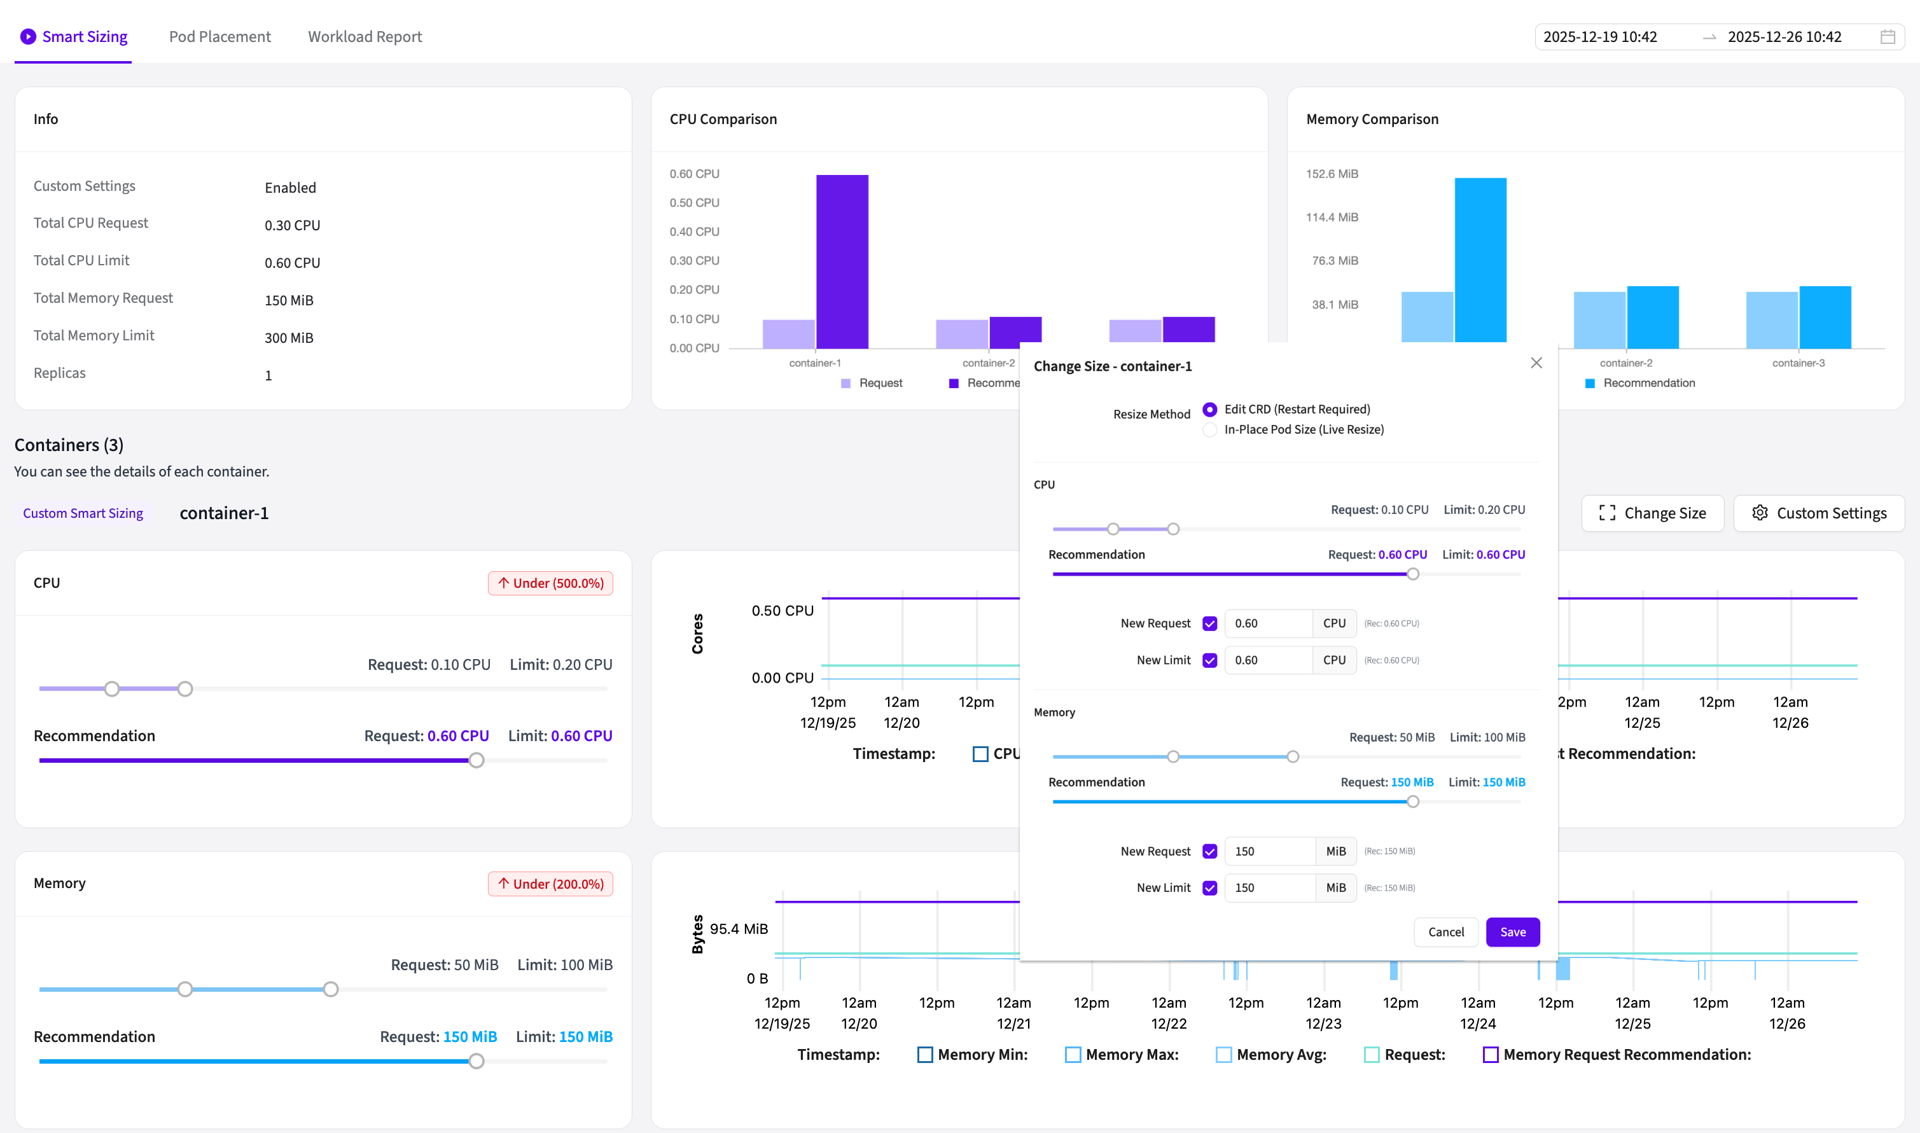
Smart Sizing provides exact values:
- current vs recommended CPU and memory
- degree of over or under-provisioning
- Apply changes with confidence using the Change Size button
No spreadsheets. No guesswork.
Unified Platform: Vertical + Horizontal Scaling
Unlike VPA, Wave Autoscale handles vertical and horizontal scaling in one unified platform, they work together, not against each other.
| Capability | VPA + HPA | Wave Autoscale |
|---|---|---|
| Vertical optimization | ✓ (VPA) | ✓ (Smart Sizing) |
| Horizontal scaling | ✓ (HPA) | ✓ (Autopilot) |
| Work together | ✗ Conflict | ✓ Unified |
| CPU pressure metrics | ✗ | ✓ |
| Network awareness | ✗ | ✓ |
One platform, complete coverage:
- Vertical optimization right-sizes container resources
- Horizontal scaling adjusts pod count based on demand
- Shared intelligence: both systems inform each other
Cluster-Wide Visibility and Cost Savings
Wave Autoscale gives you full insight across the cluster:
- every container classified
- classification updates continuously
- automatic cost impact calculation
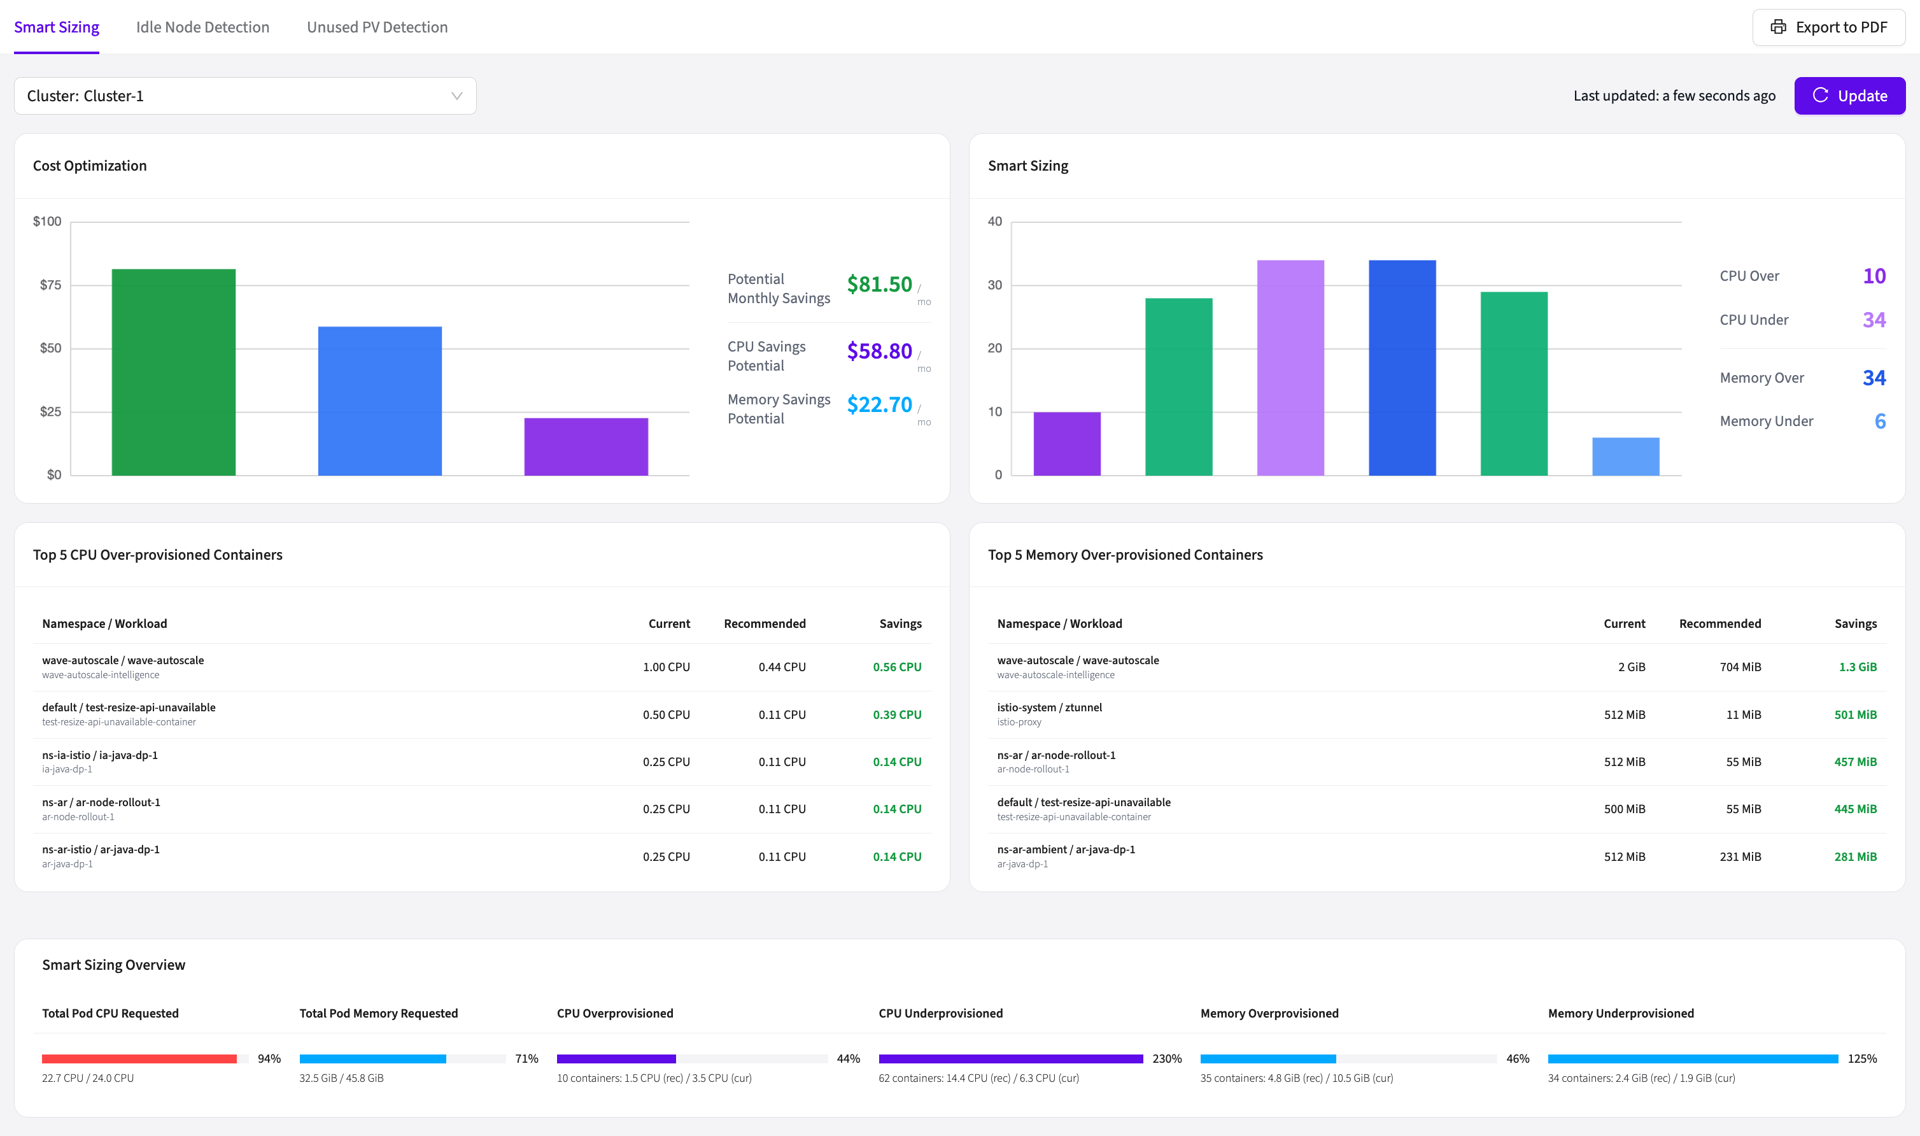
Cluster-wide dashboard showing provisioning status across all workloads
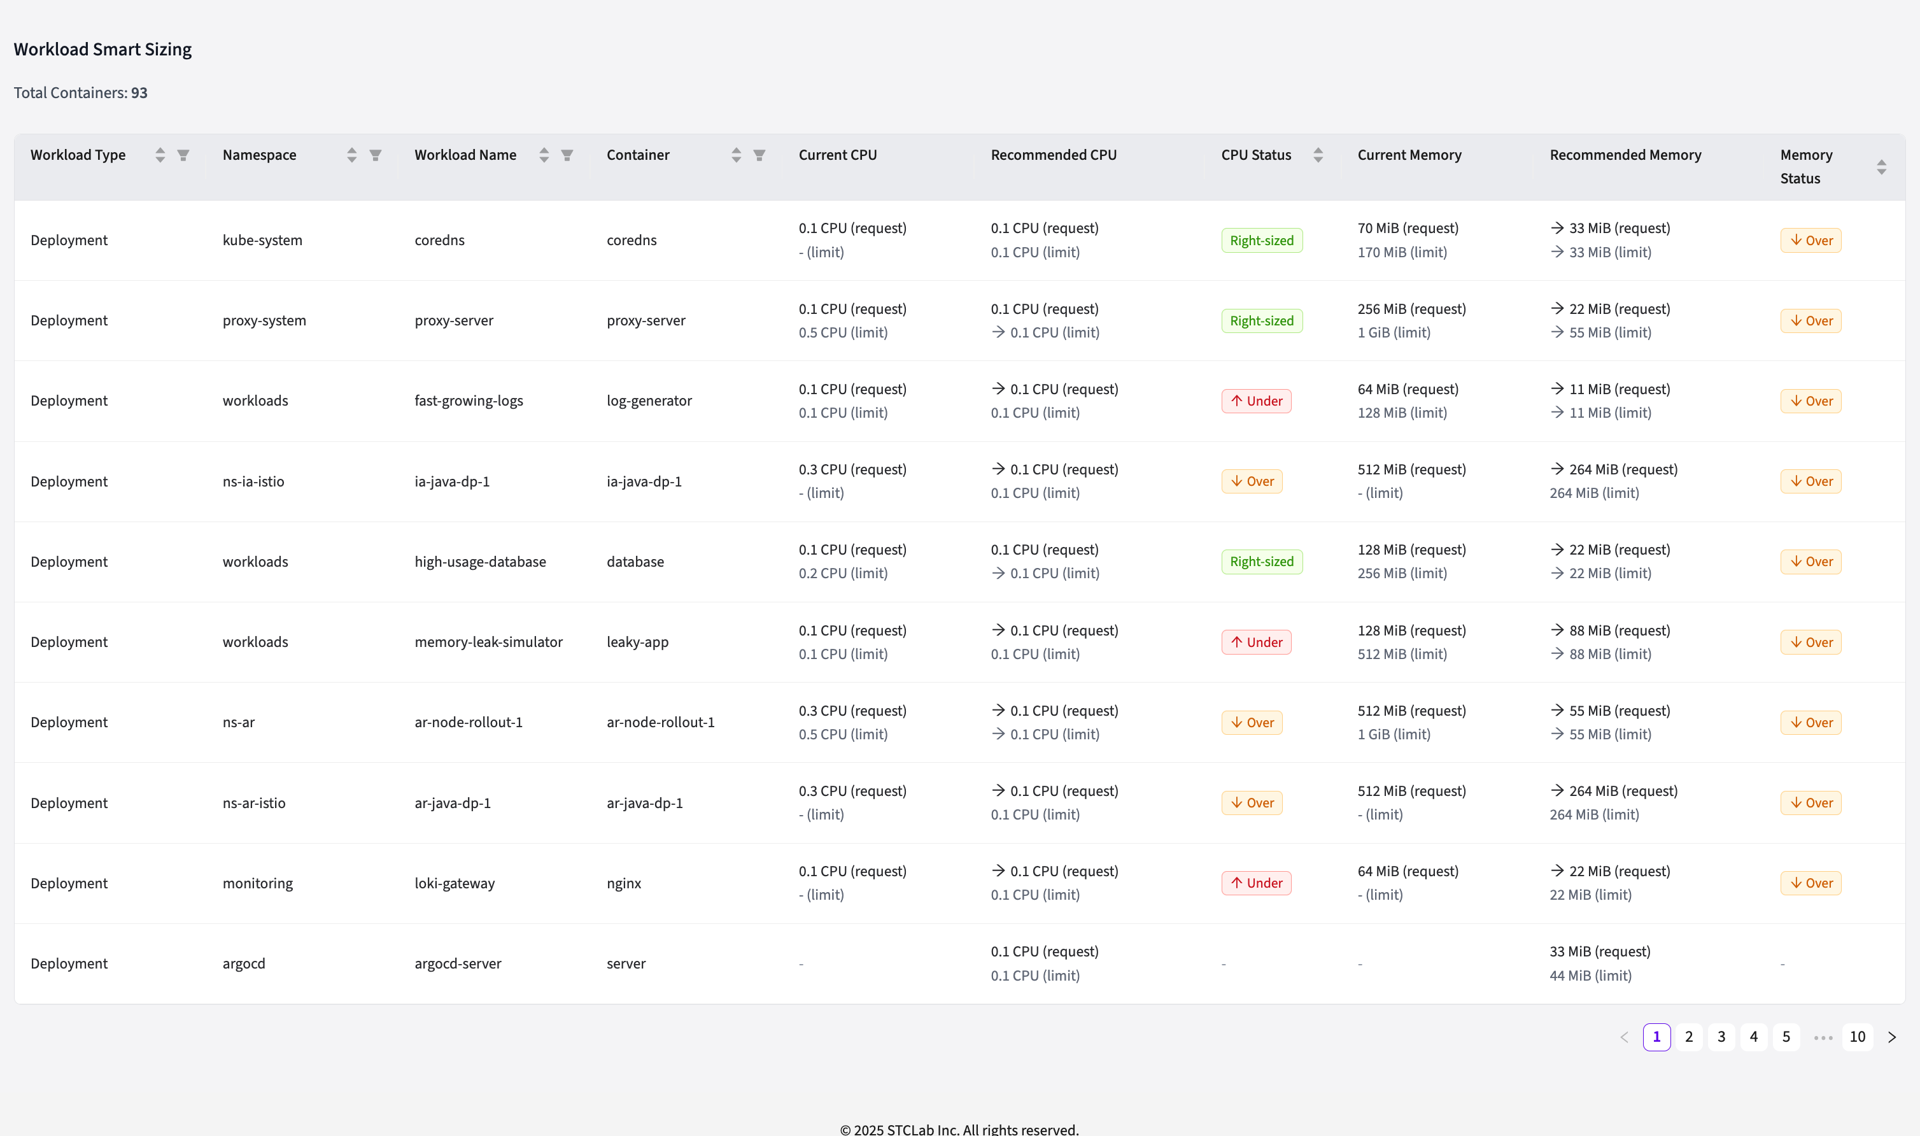
Instantly identify which containers are wasting resources or at risk
Conclusion: Right Size Smarter, Not Harder
Manual rightsizing is possible, but expensive — often 25–100 hours of engineering time per month.
VPA helps, but it is constrained by limited metrics and cannot operate alongside HPA.
Wave Autoscale closes these gaps:
- better metrics (CPU pressure, network awareness)
- unified scaling (vertical + horizontal)
- cluster-wide reporting
- actionable recommendations
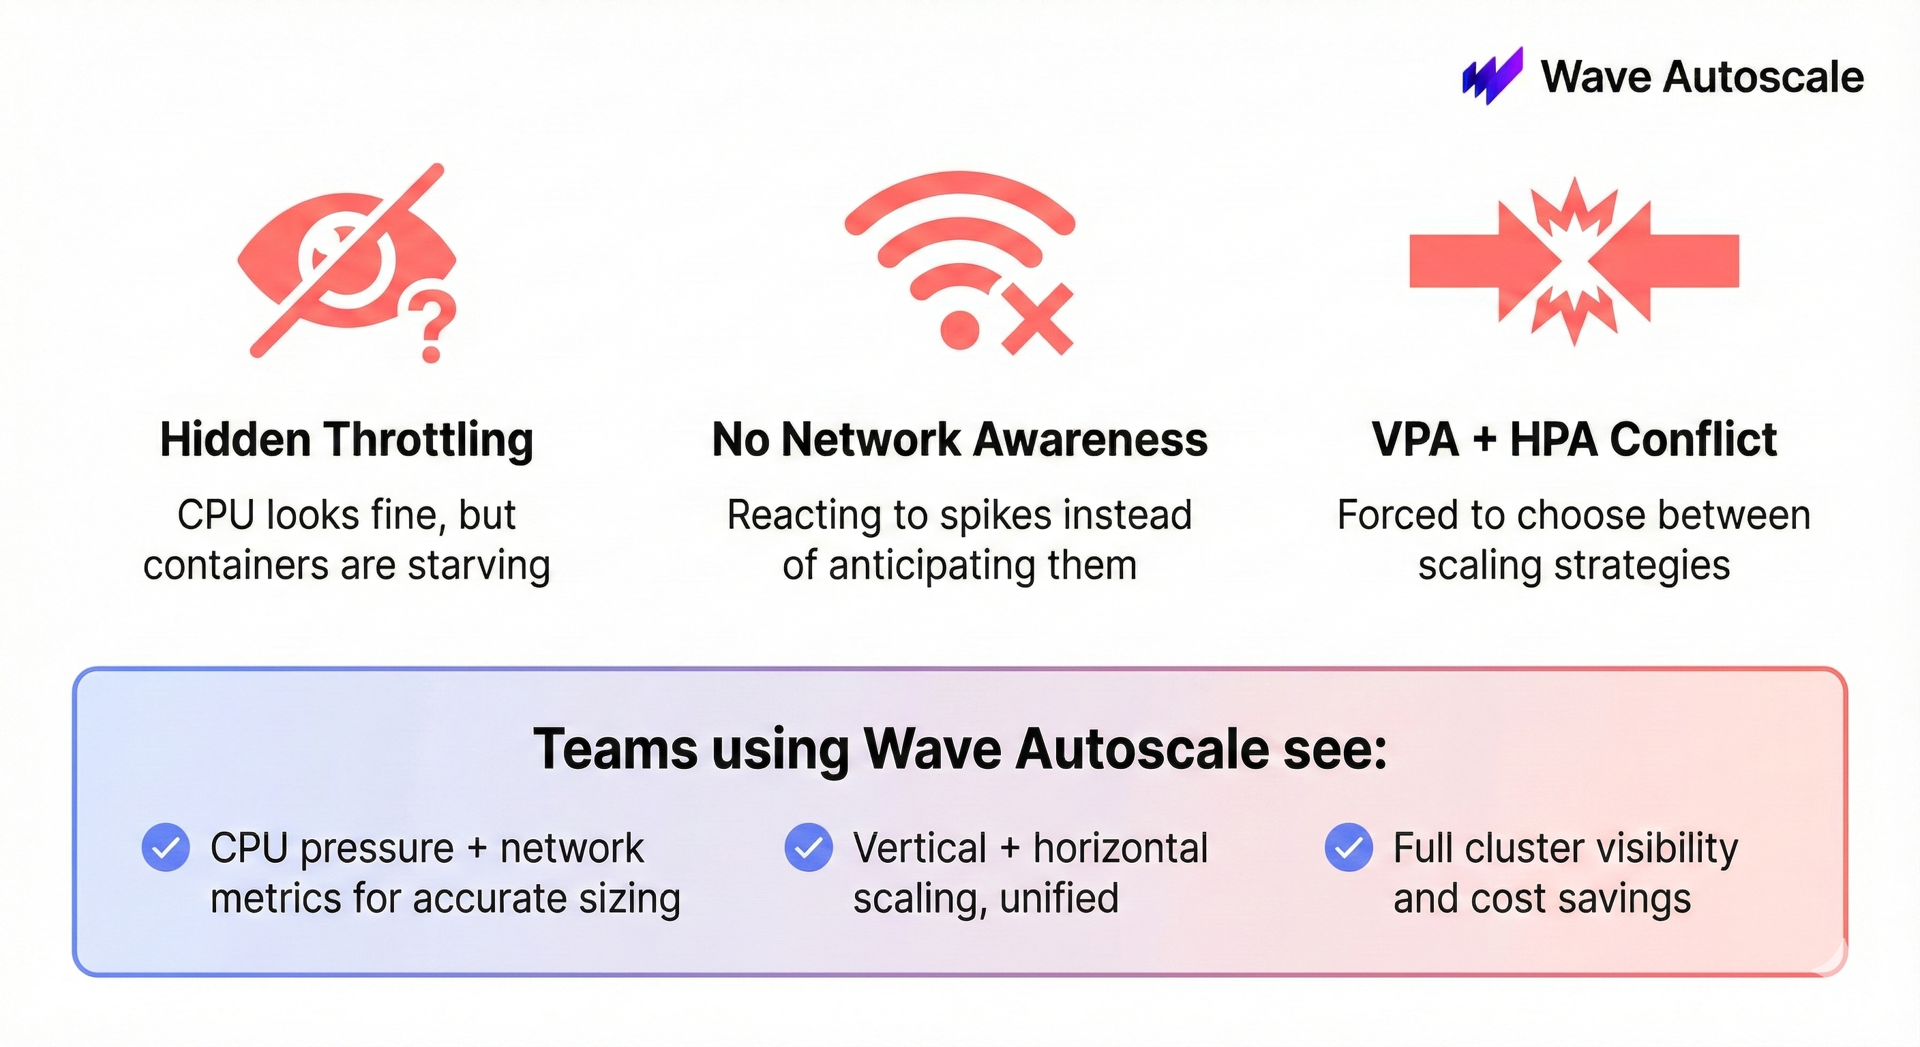
Teams using Wave Autoscale achieve:
- up to 2× faster scaling response
- up to 40 percent cost savings
- predictive scaling
- smart resource sizing
- priority-based traffic shaping
All while keeping engineers focused on building features instead of tuning thresholds.