Wave Autoscale 2.4.0 Release
Author: Hwansoo Kim (opens in a new tab)
Date: April 23, 2025
Wave Autoscale 2.4.0 brings enhanced observability, smarter scaling strategies, and more control over deployment behavior. This release focuses on reducing operational overhead and providing deeper insights for performance optimization at scale.
🚀 Autopilot Scheduler
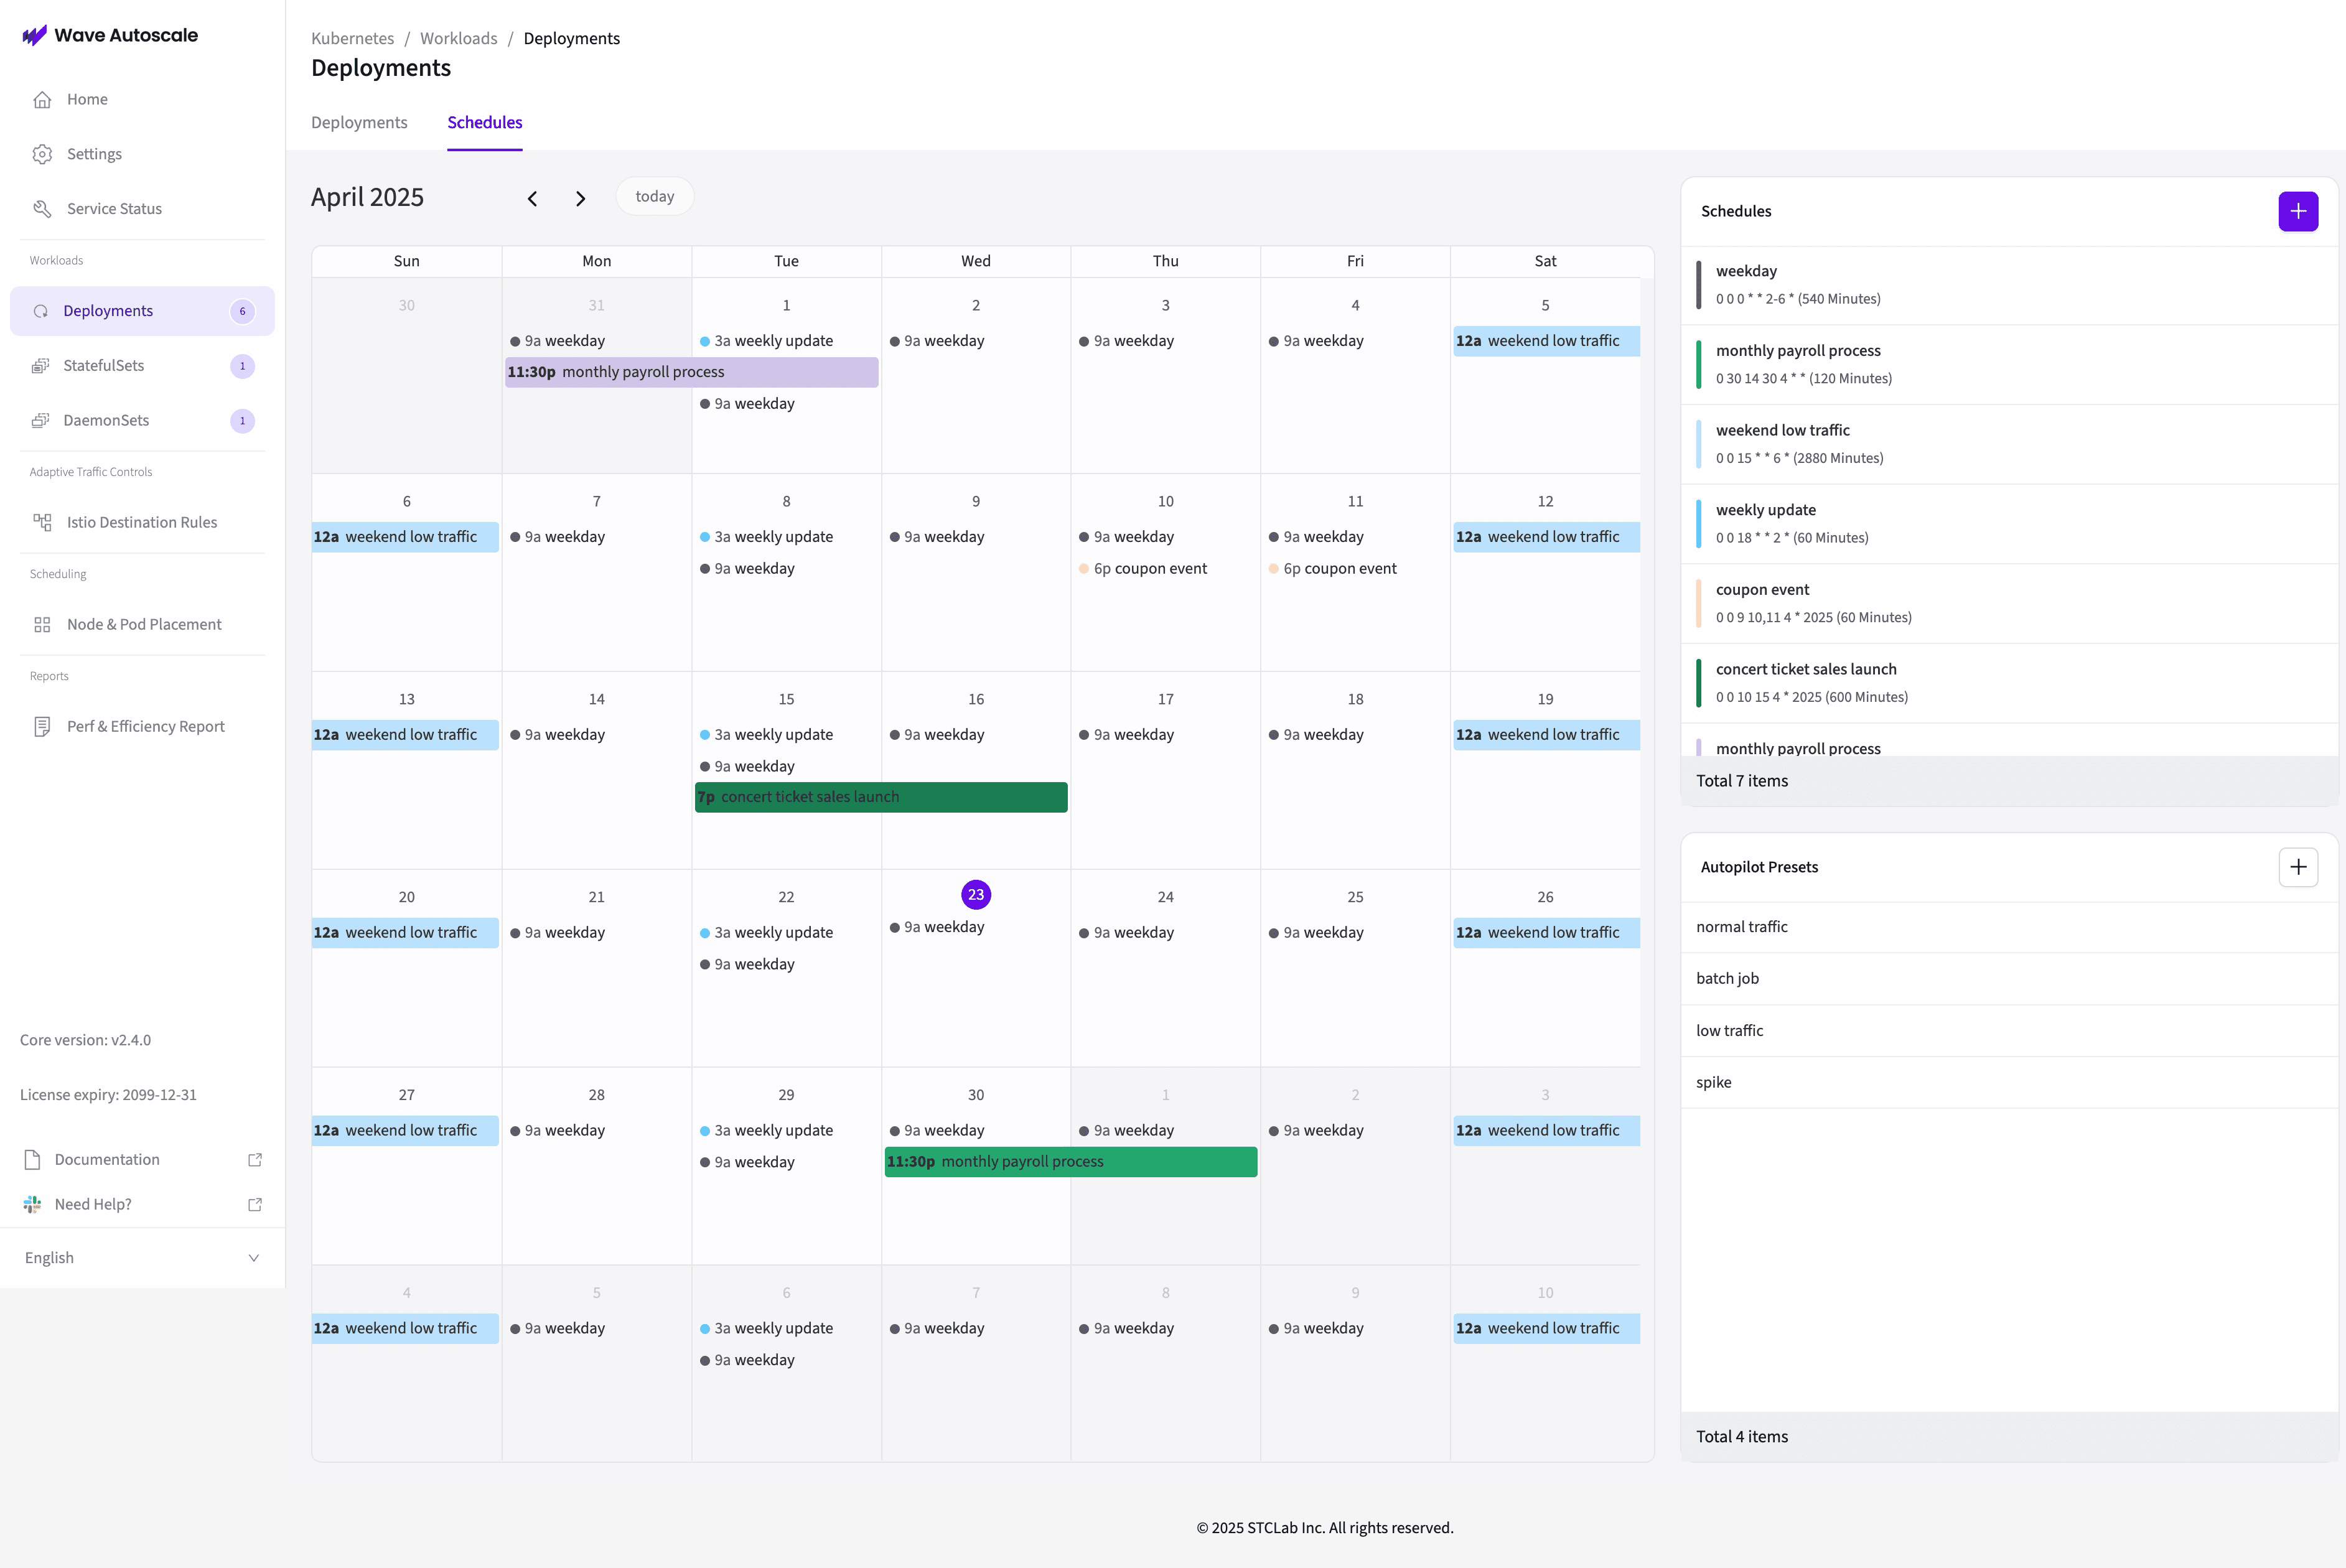
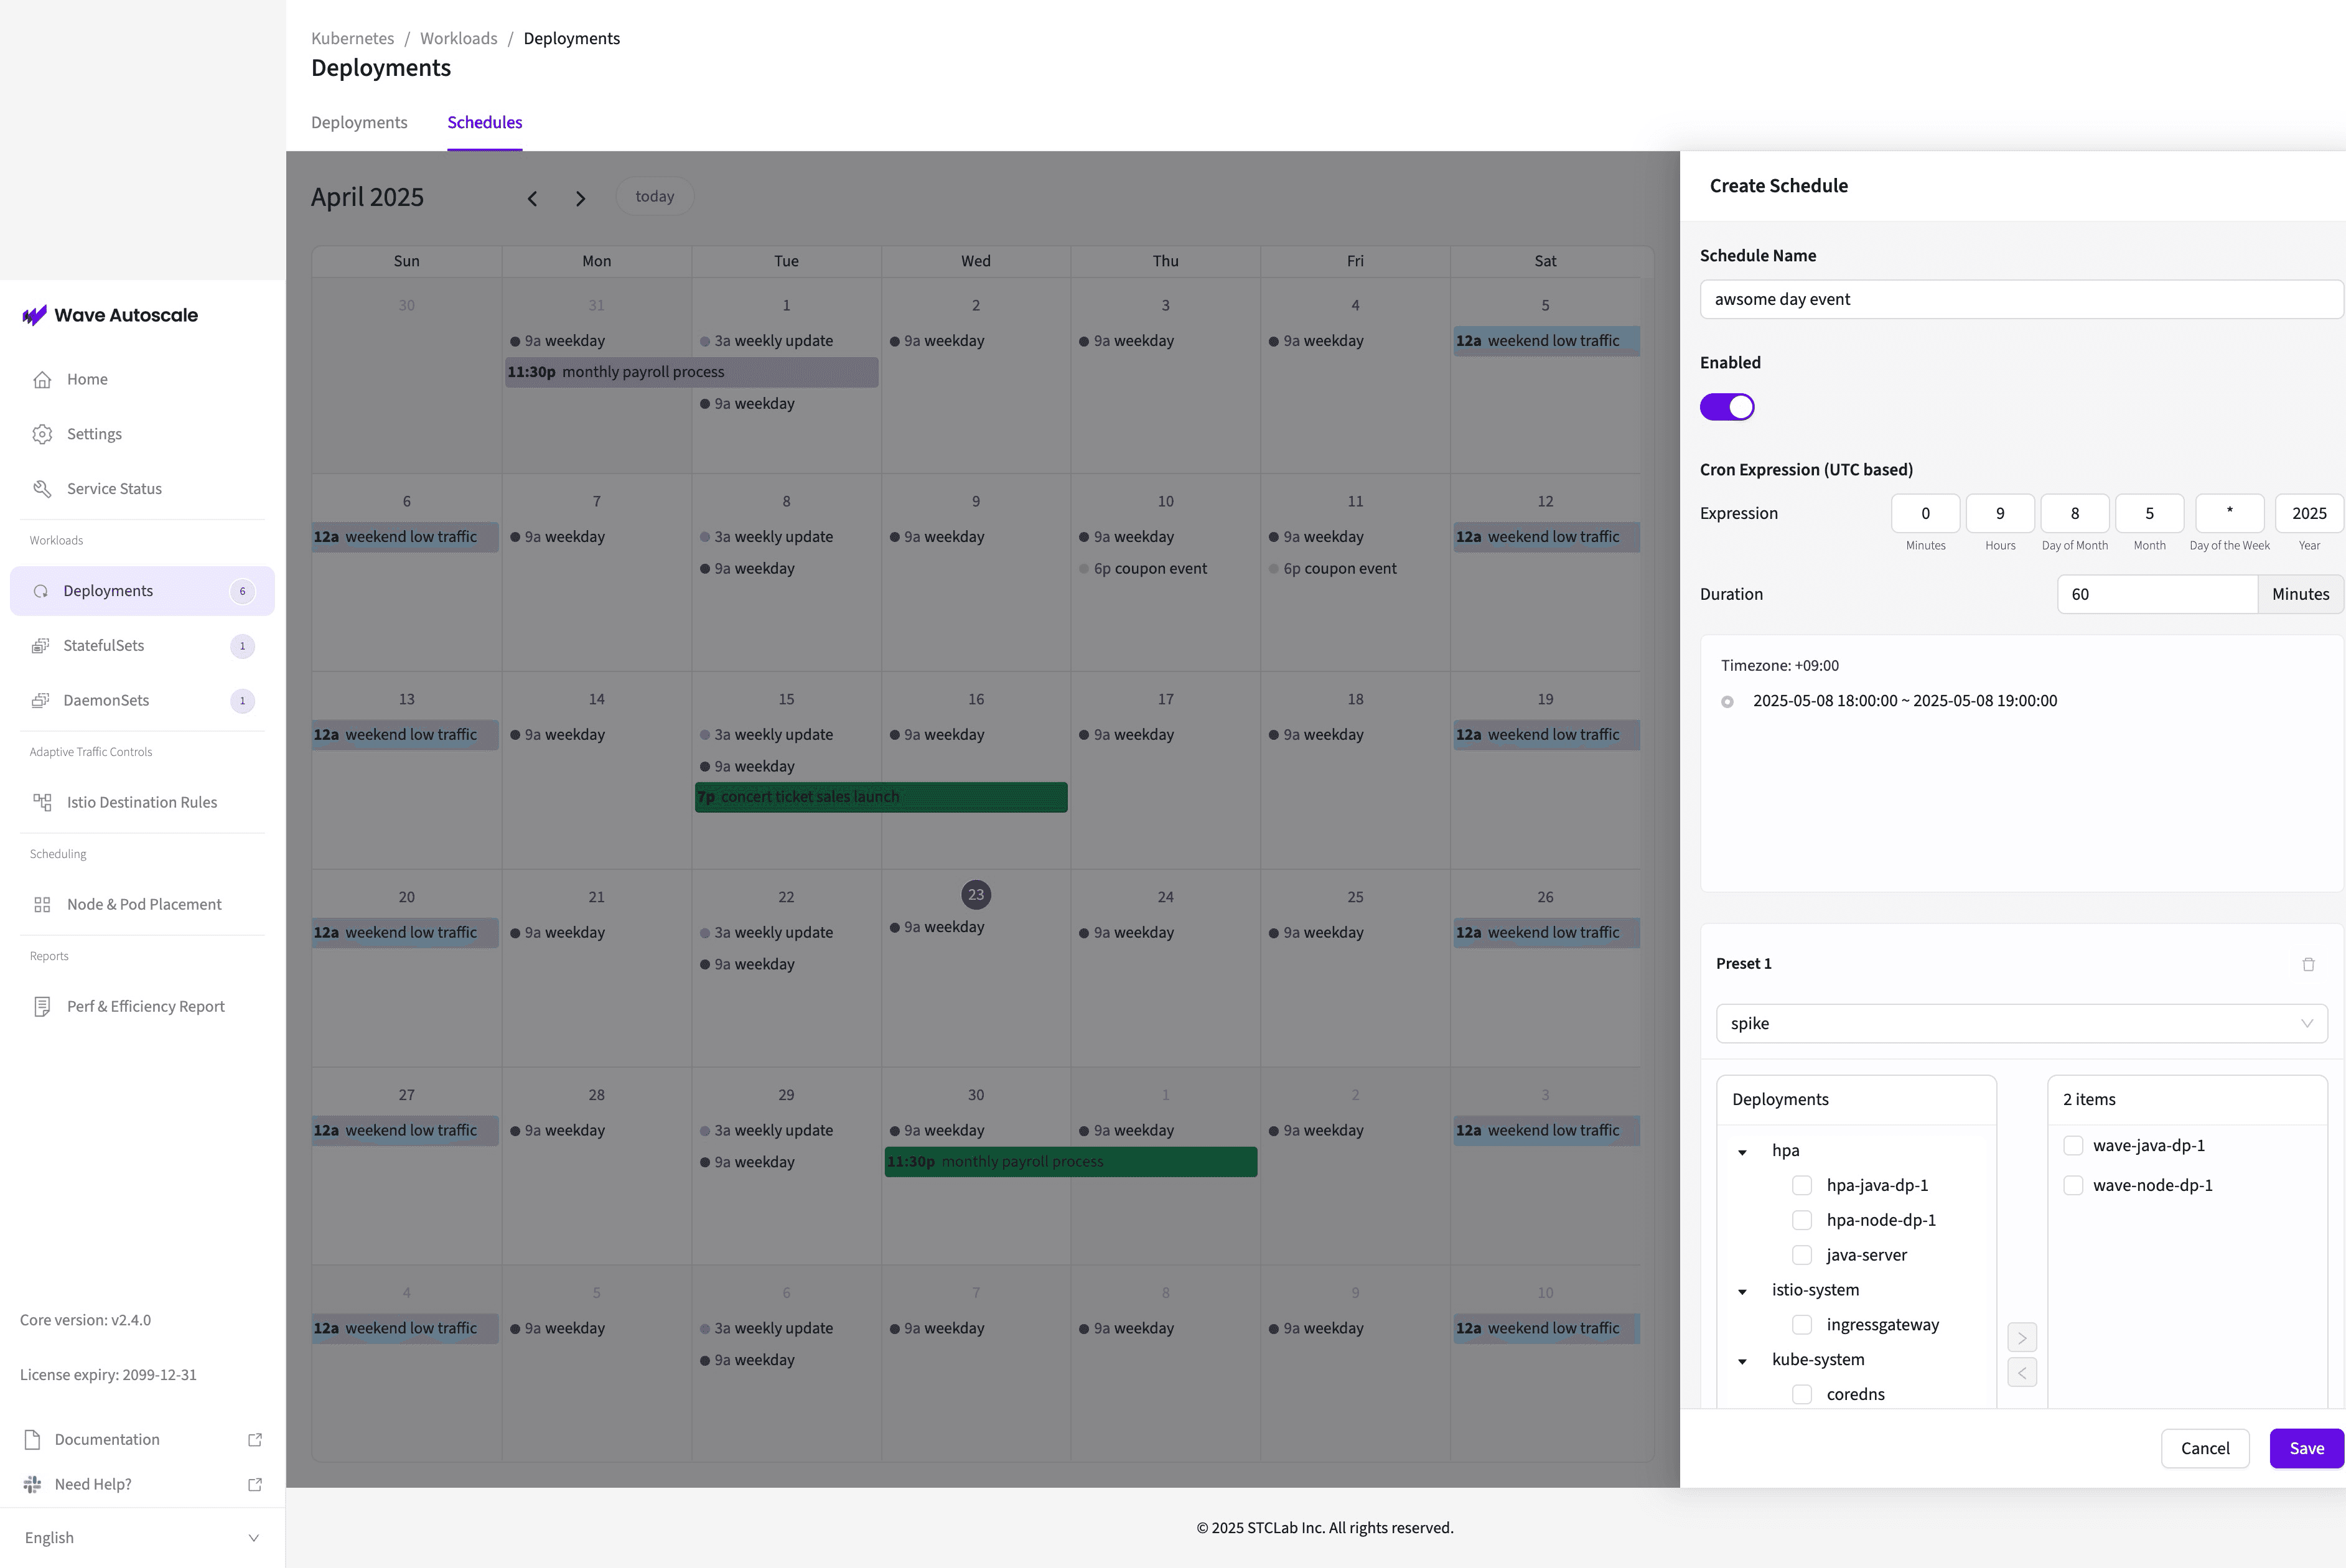
Wave Autoscale now supports cron-based Autopilot scheduling. Define recurring or one-time scaling behaviors aligned with known traffic patterns. Group deployments under a unified schedule to reduce manual effort and ensure system readiness during key events.
🎯 Min/Max Recommendation (Proactive Optimization)
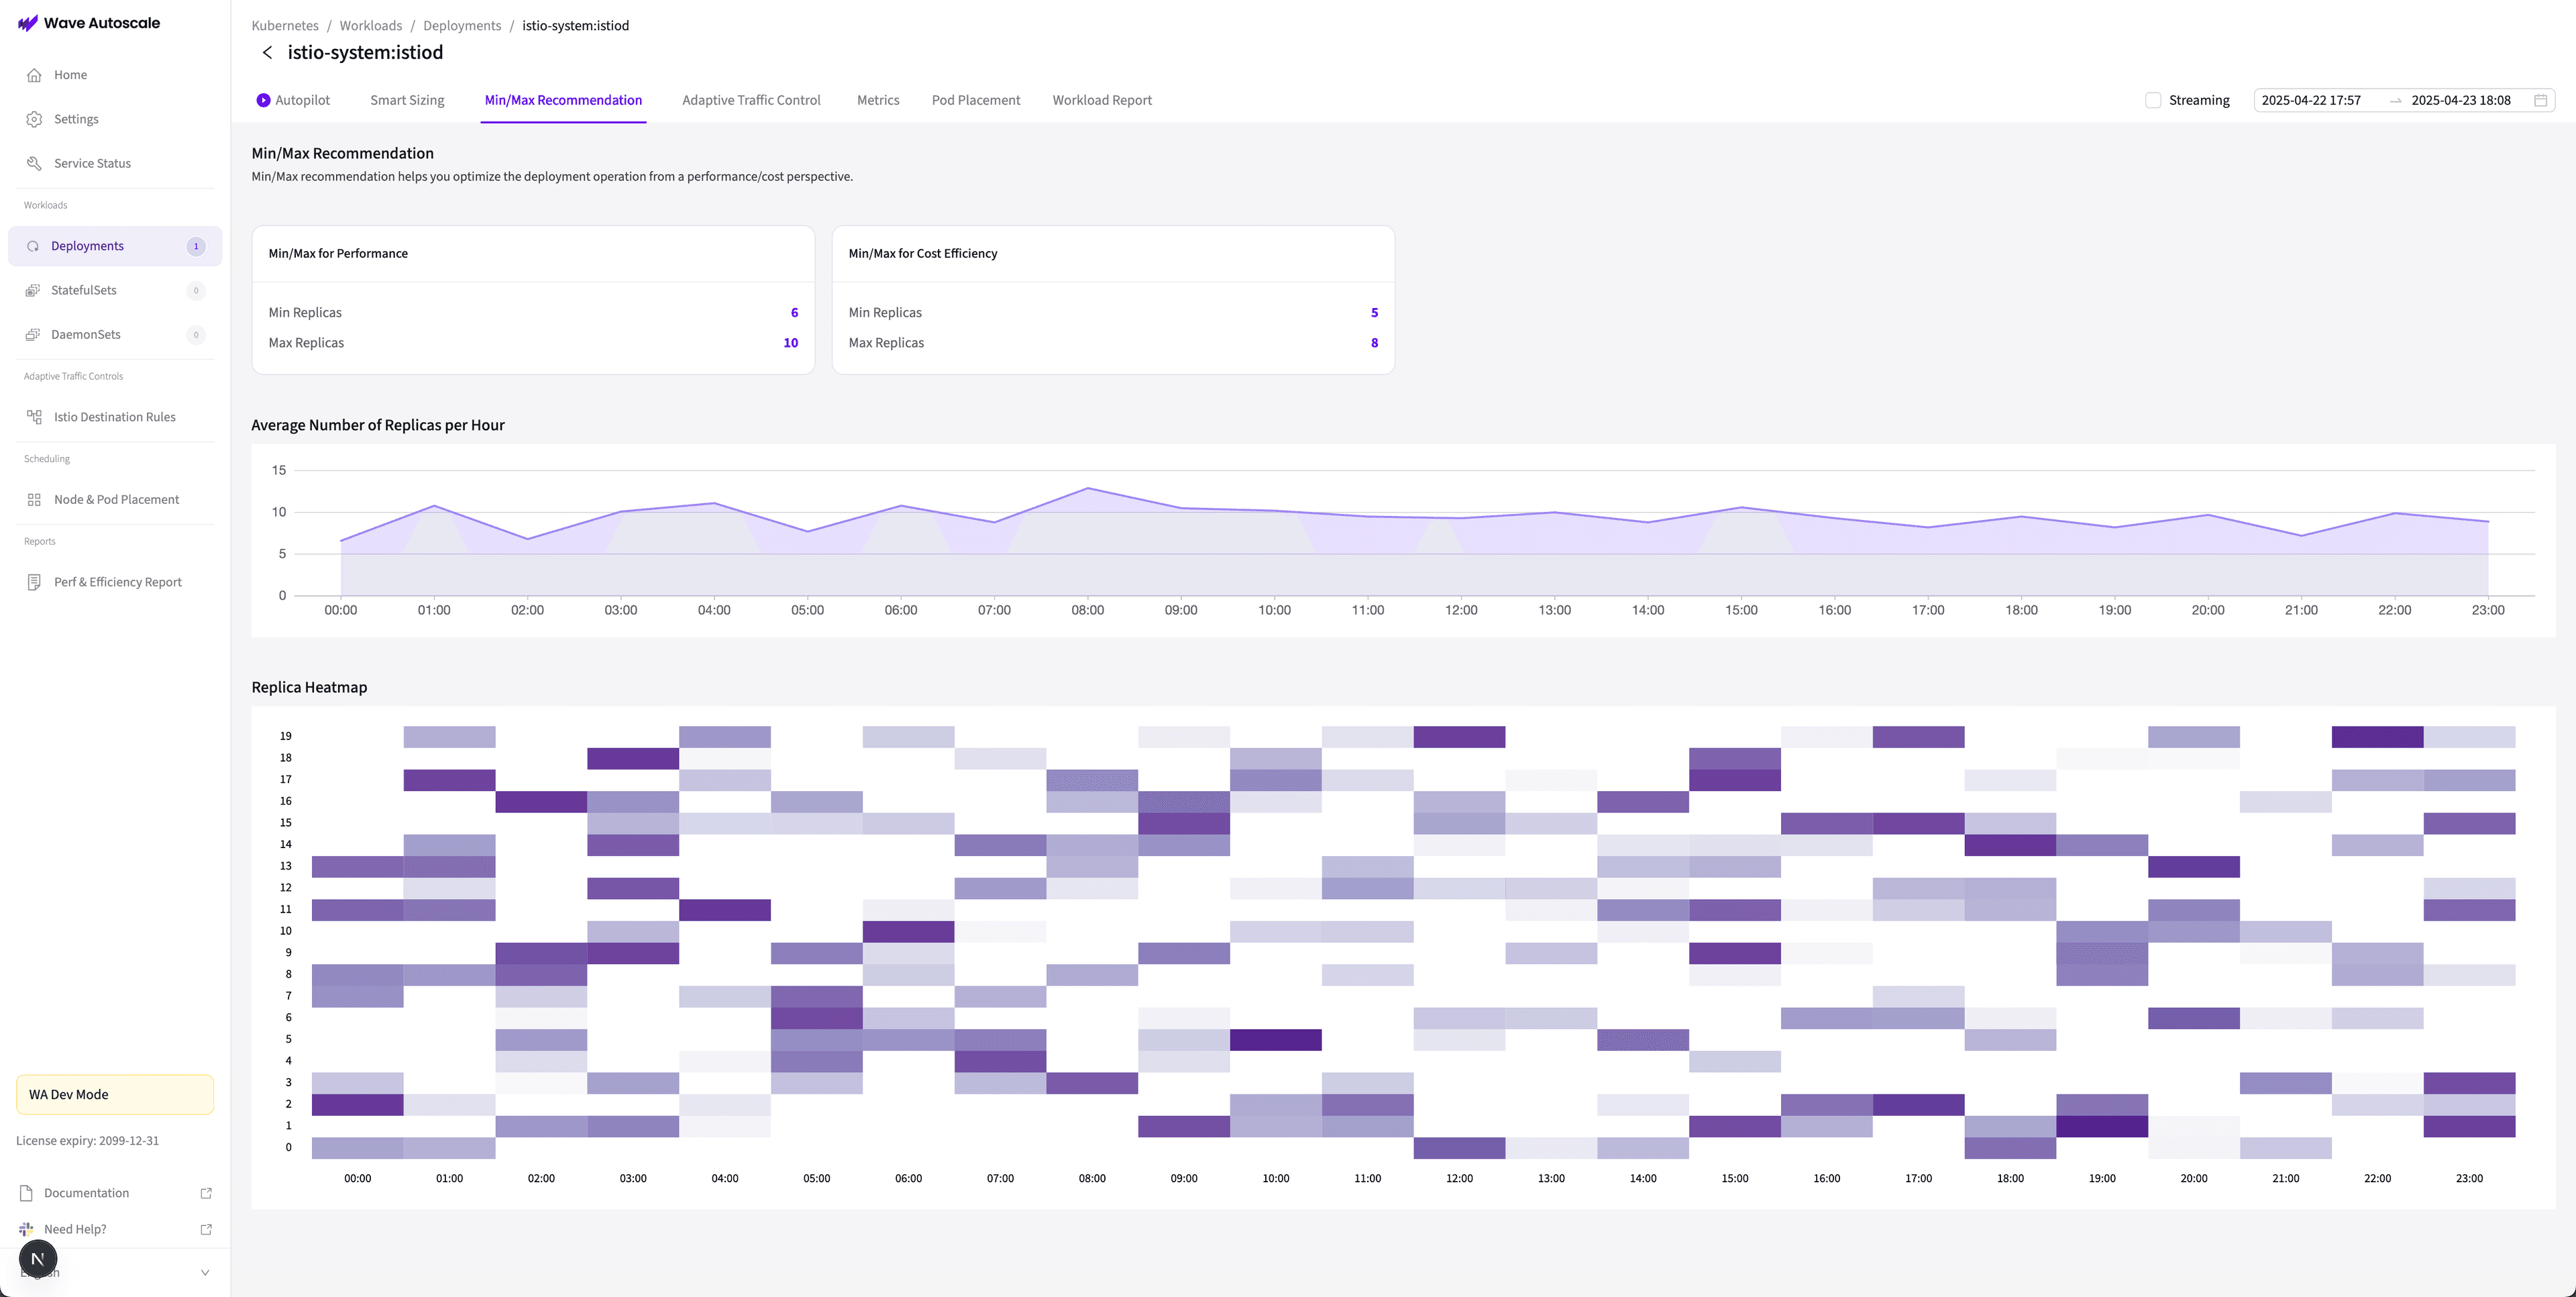
Automatically receive data-driven recommendations for minReplicas and maxReplicas based on Wave Autoscale Autopilot. Choose between performance-focused or cost-efficient configurations to fine-tune your autoscaling strategy.
🔍 Unlike conventional observability platforms that only visualize current replica states, Wave Autoscale proactively suggests optimal scaling bounds derived from Autopilot behavior, so engineers don’t have to guess or manually adjust.
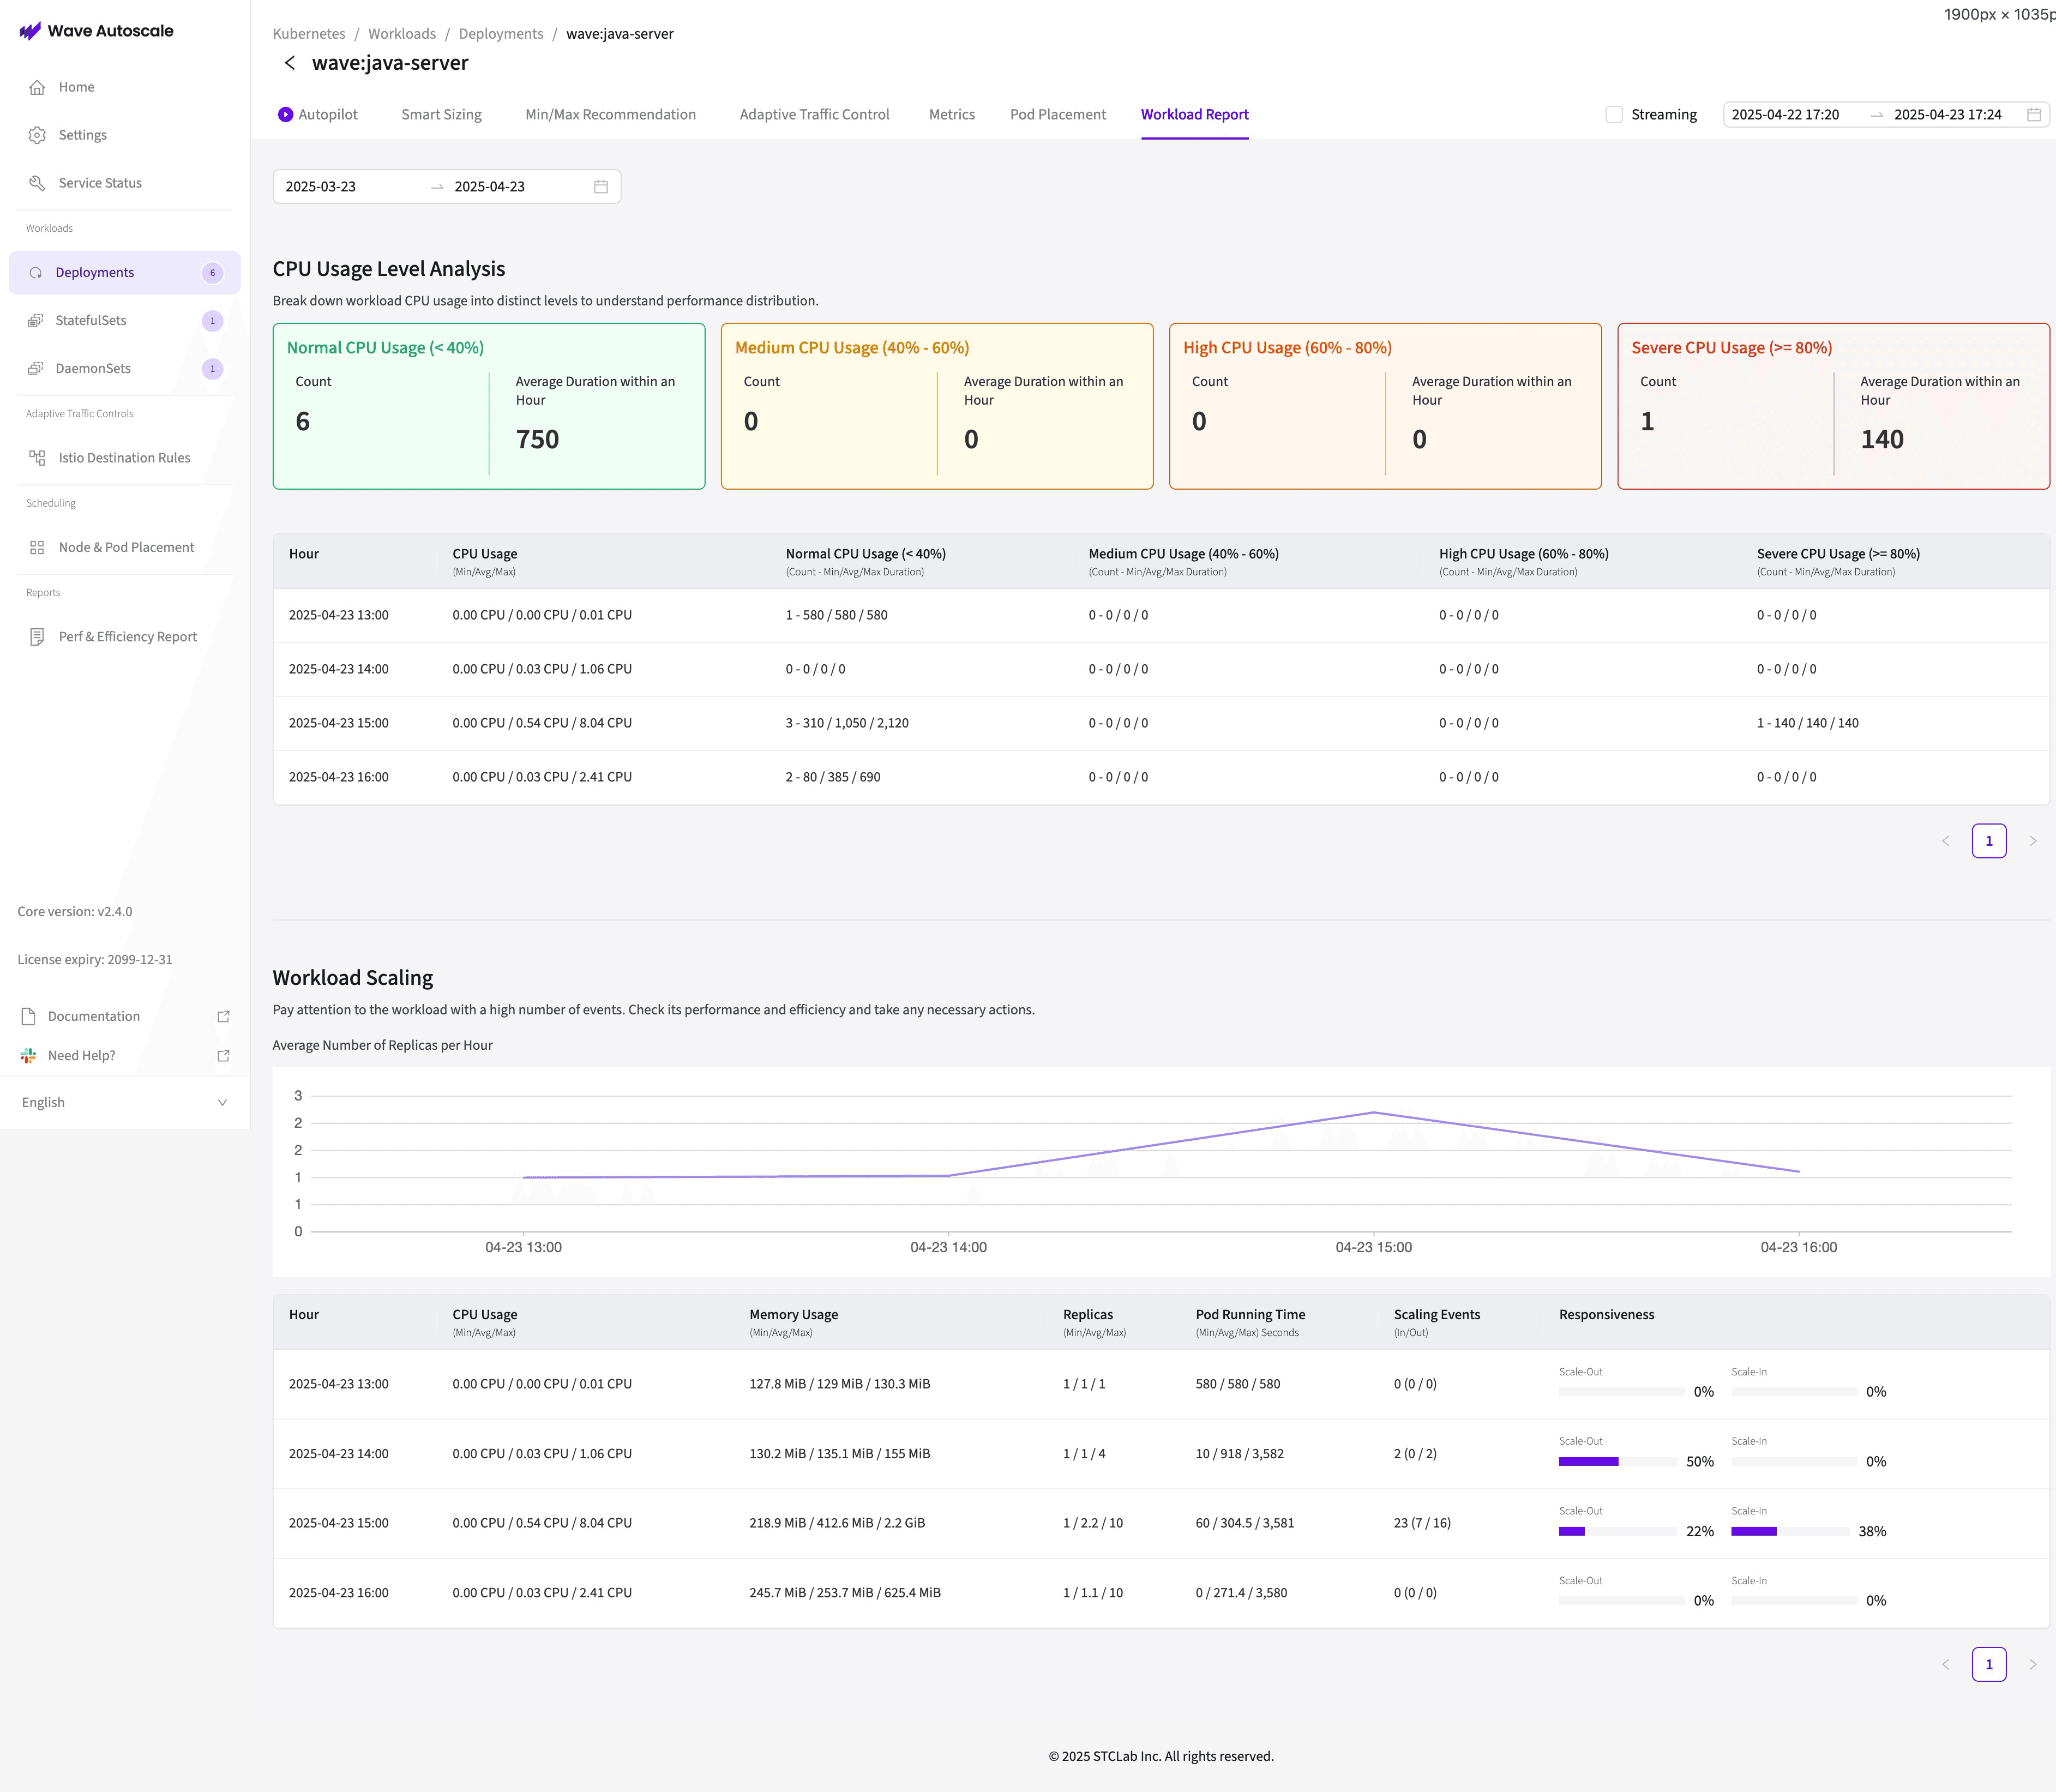
📈 CPU Usage Level Analysis (Visibility)
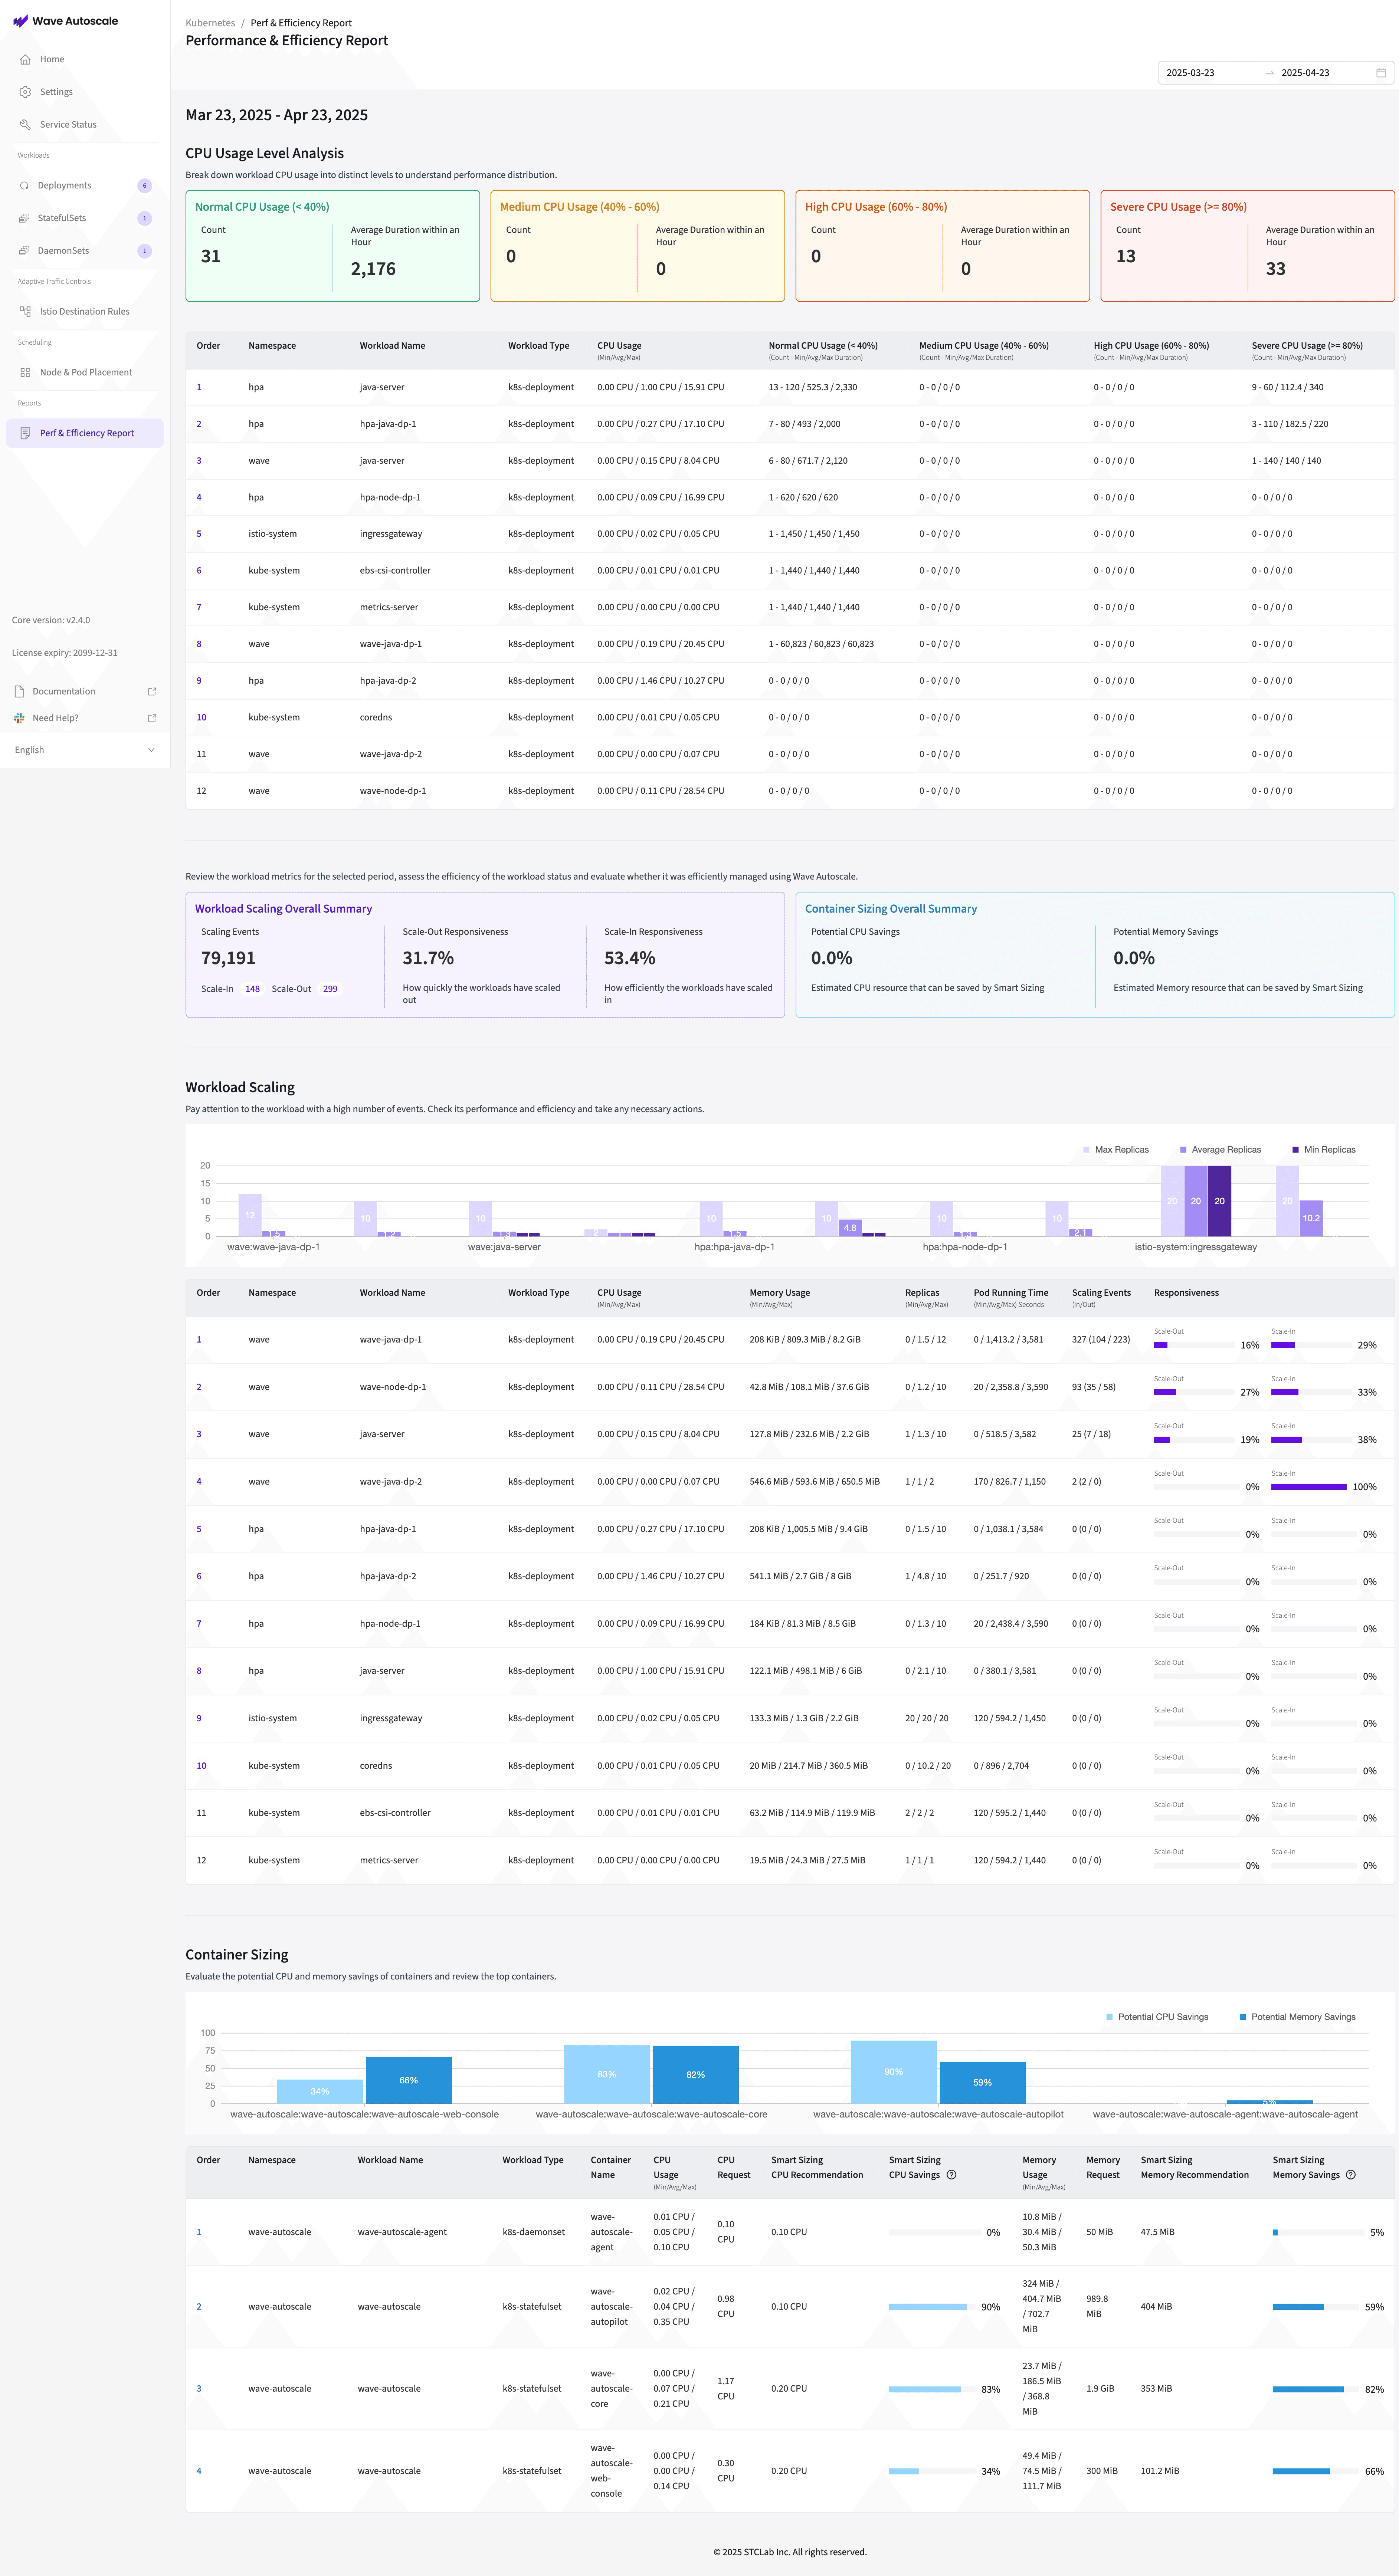
All workloads are now categorized by CPU utilization into four tiers—Low, Medium, High, and Severe. This gives SREs an immediate view into performance bottlenecks and resource overuse.
Visible in both:
- Global performance reports
- Individual deployment dashboards
✅ What sets this apart: Traditional monitoring tools can tell you what your CPU usage is.
But Wave Autoscale interprets what that usage means in terms of workload health, risk levels, and scaling urgency—turning raw data into actionable classifications, inspired by regulatory-grade thresholding.
📄 Workload Report View (Per-Deployment Insight)
Each deployment now features a dedicated workload report tab. Monitor hourly replica usage, CPU/memory metrics, and scaling responsiveness. Perfect for debugging or post-mortem analysis.
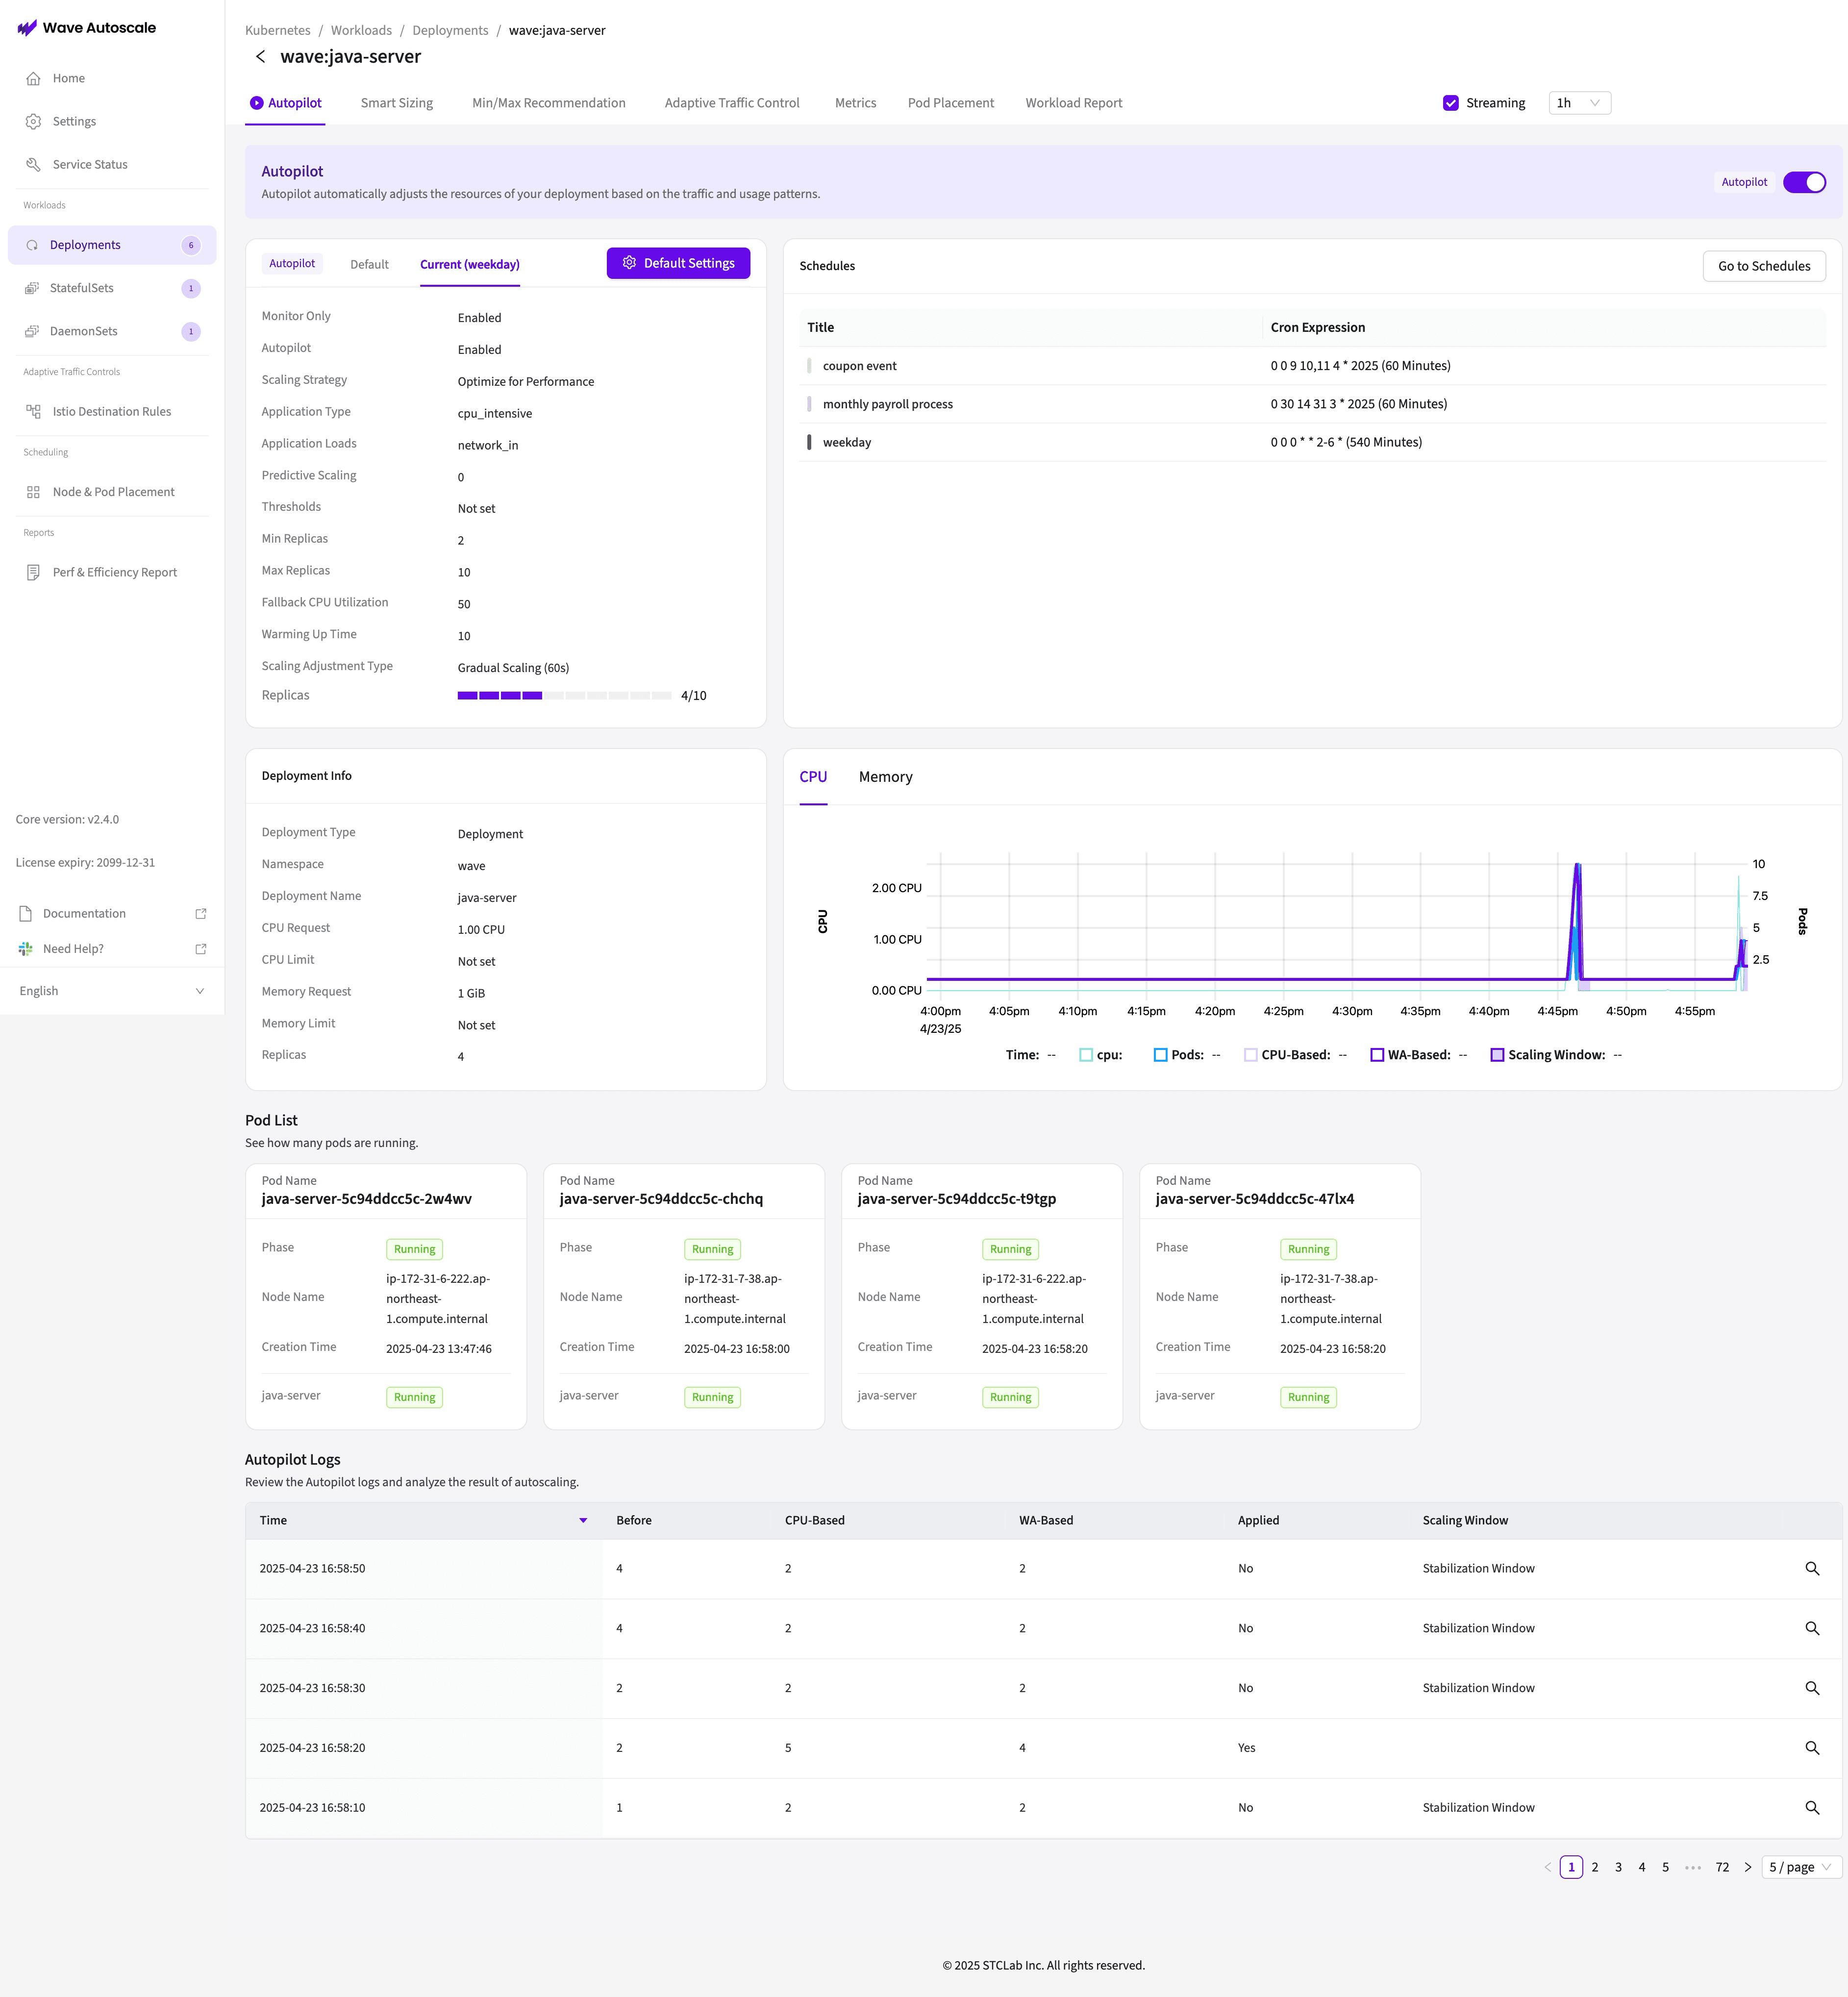
📦 Pod List in Deployment View (Debugging & Monitoring)
A new pod detail pane helps users view all pods tied to a deployment. Inspect pod statuses, container health, node locations, and start times—right from the UI.
🛠 While most tools just list pods, Wave Autoscale connects the dots—linking pod behavior back to deployment-level scaling decisions and node constraints.
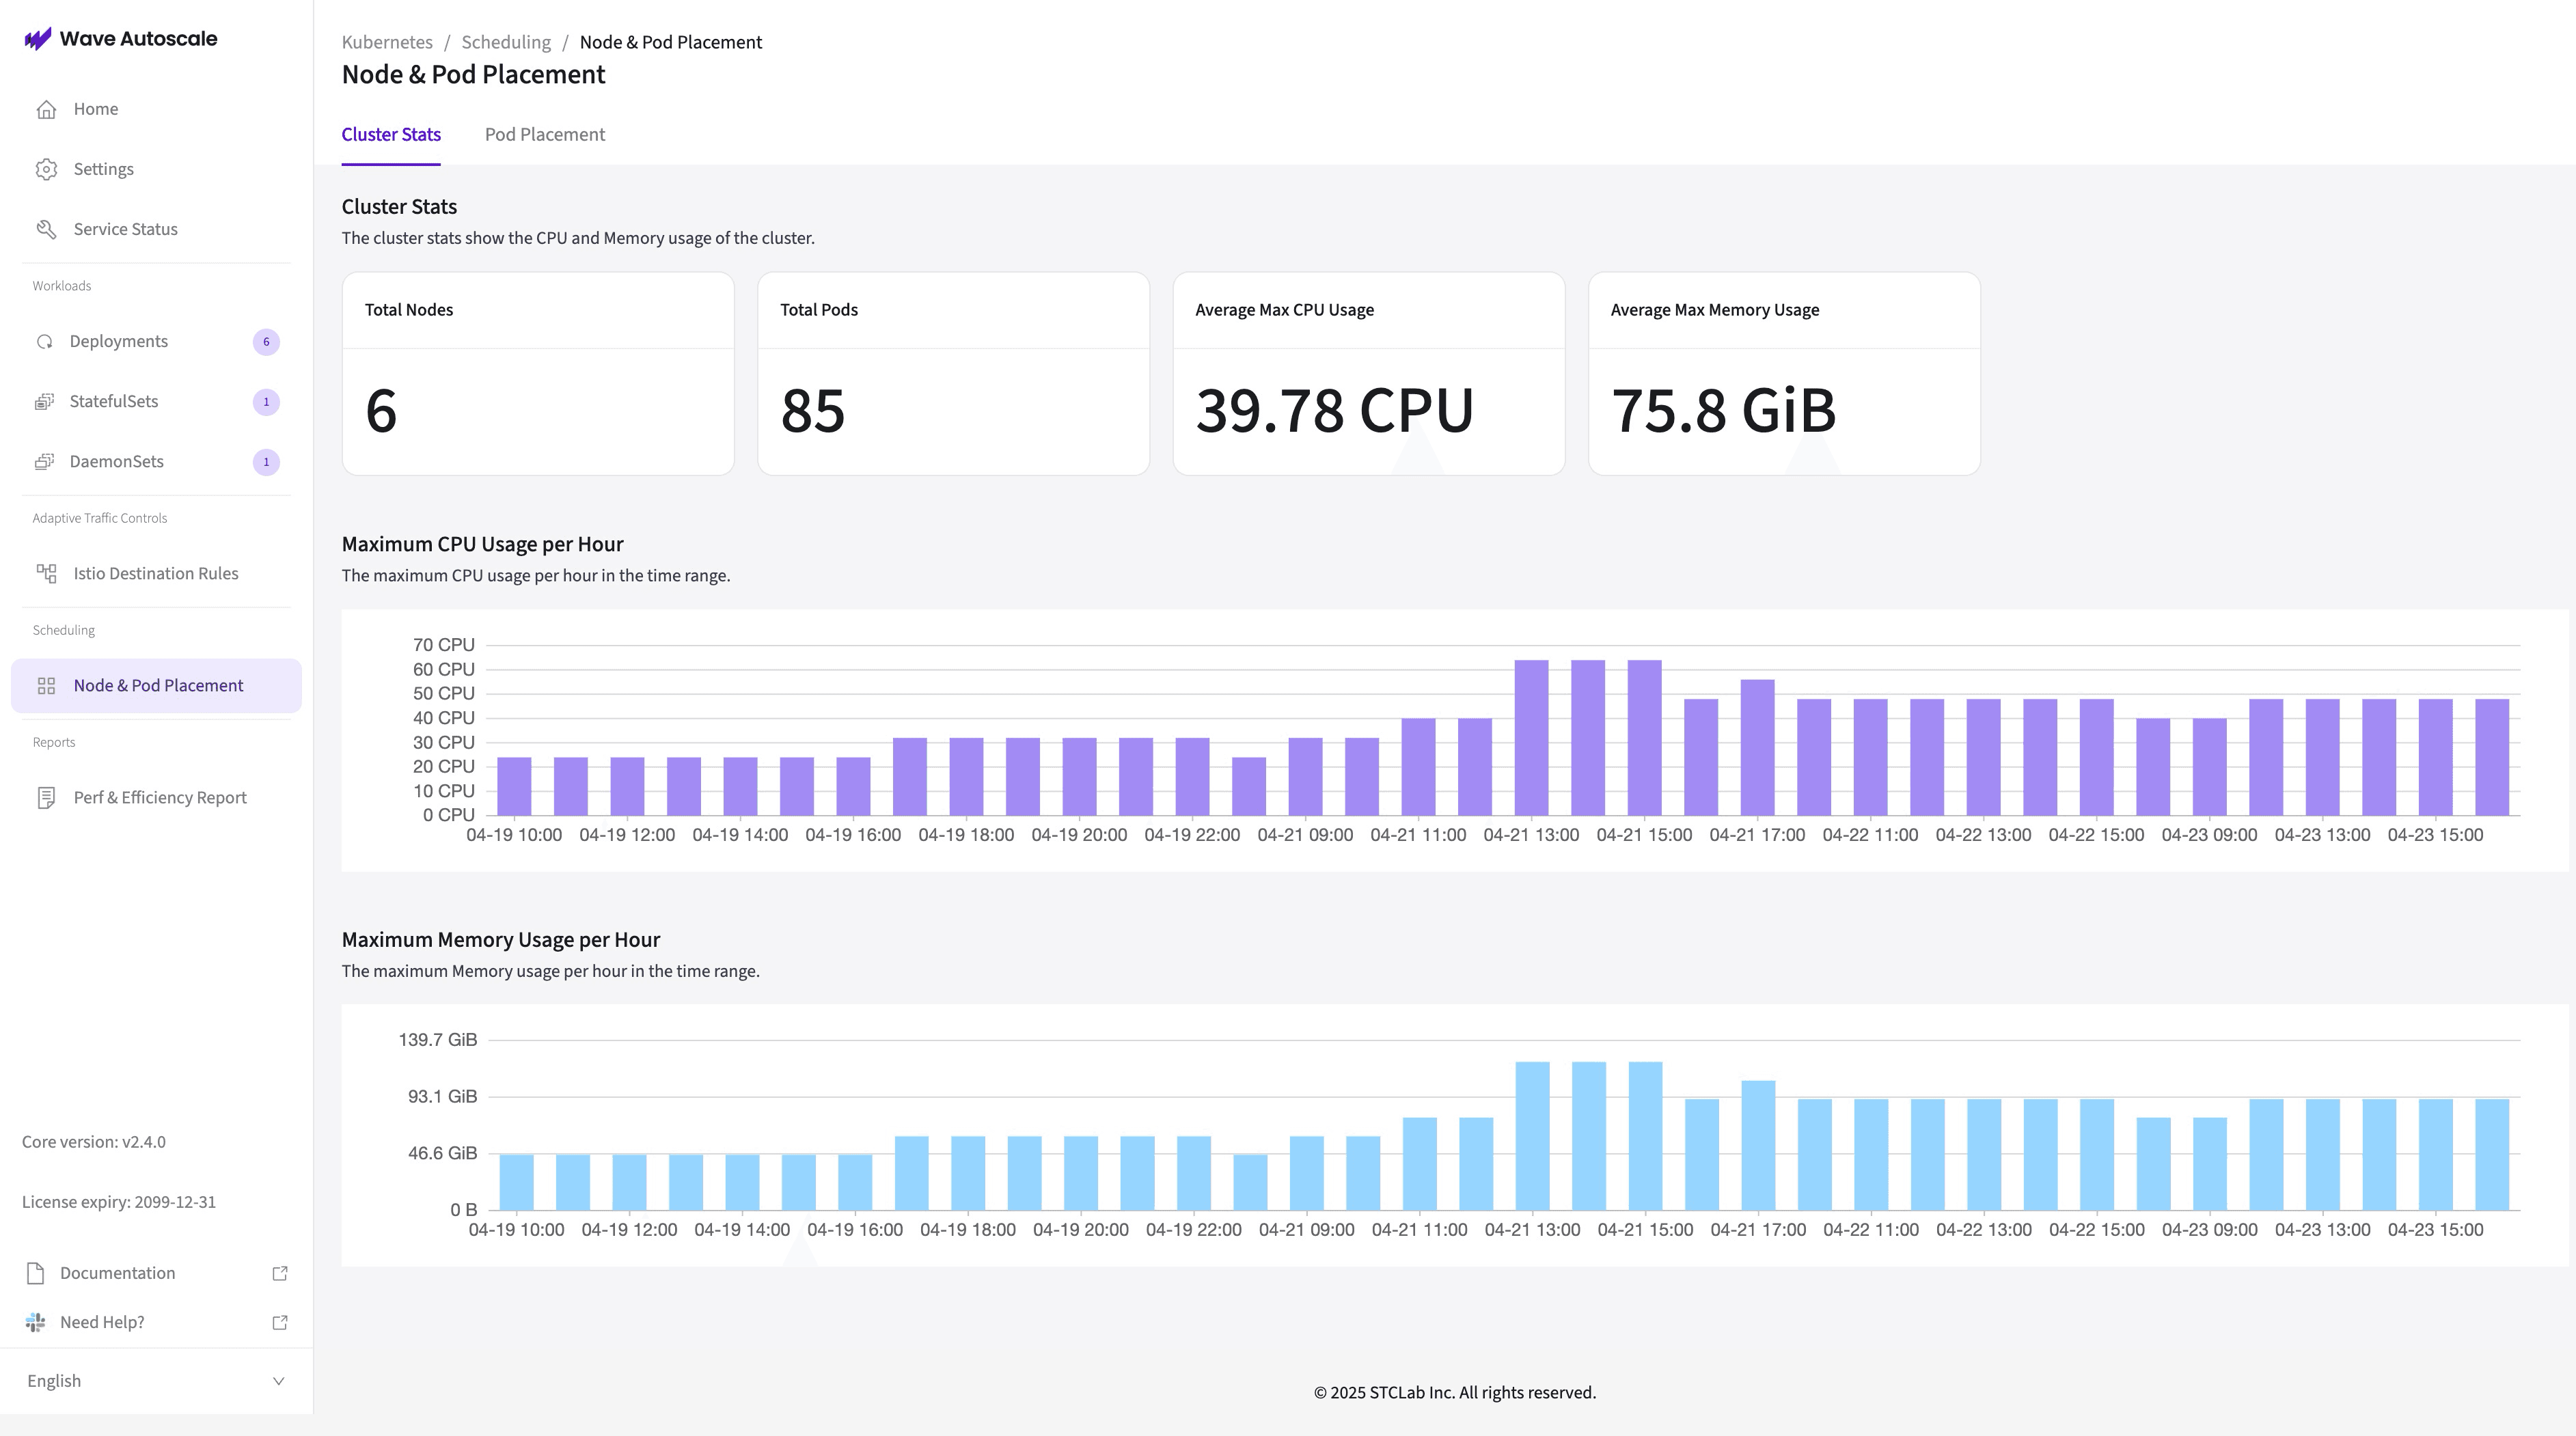
📊 Cluster Stats (Macro Resource Insights)
Quickly visualize cluster-wide CPU and memory usage patterns at hourly resolution. Identify when your infrastructure hits peak loads to better inform node-level scaling and placement.
🌐 Unlike general-purpose monitoring tools, Wave Autoscale correlates this data with past autoscaling events, revealing systemic bottlenecks and helping you plan infra upgrades with clarity.
🧊 Image Size Optimization (Faster, Lighter Deployments)
We’ve significantly reduced image sizes for faster pulls and more efficient resource usage:
- Core Image: 144MB → 69MB (↓52%)
- Autopilot: 1,219MB → 312MB (↓75%)
- Metrics Agent: 159MB → 97MB (↓39%)
Wave Autoscale 2.4.0 continues our mission to make Kubernetes operations smarter, leaner, and more autonomous. Upgrade today to take full advantage of these capabilities.
Want to get started? Book a demo → (opens in a new tab)