Karpenter Dashboard
Karpenter Dashboard는 모든 NodePool에 걸쳐 Karpenter가 프로비저닝한 노드를 실시간으로 확인할 수 있게 해줍니다. 대시보드에 접근하려면 사이드바에서 Karpenter > Overview로 이동하세요.
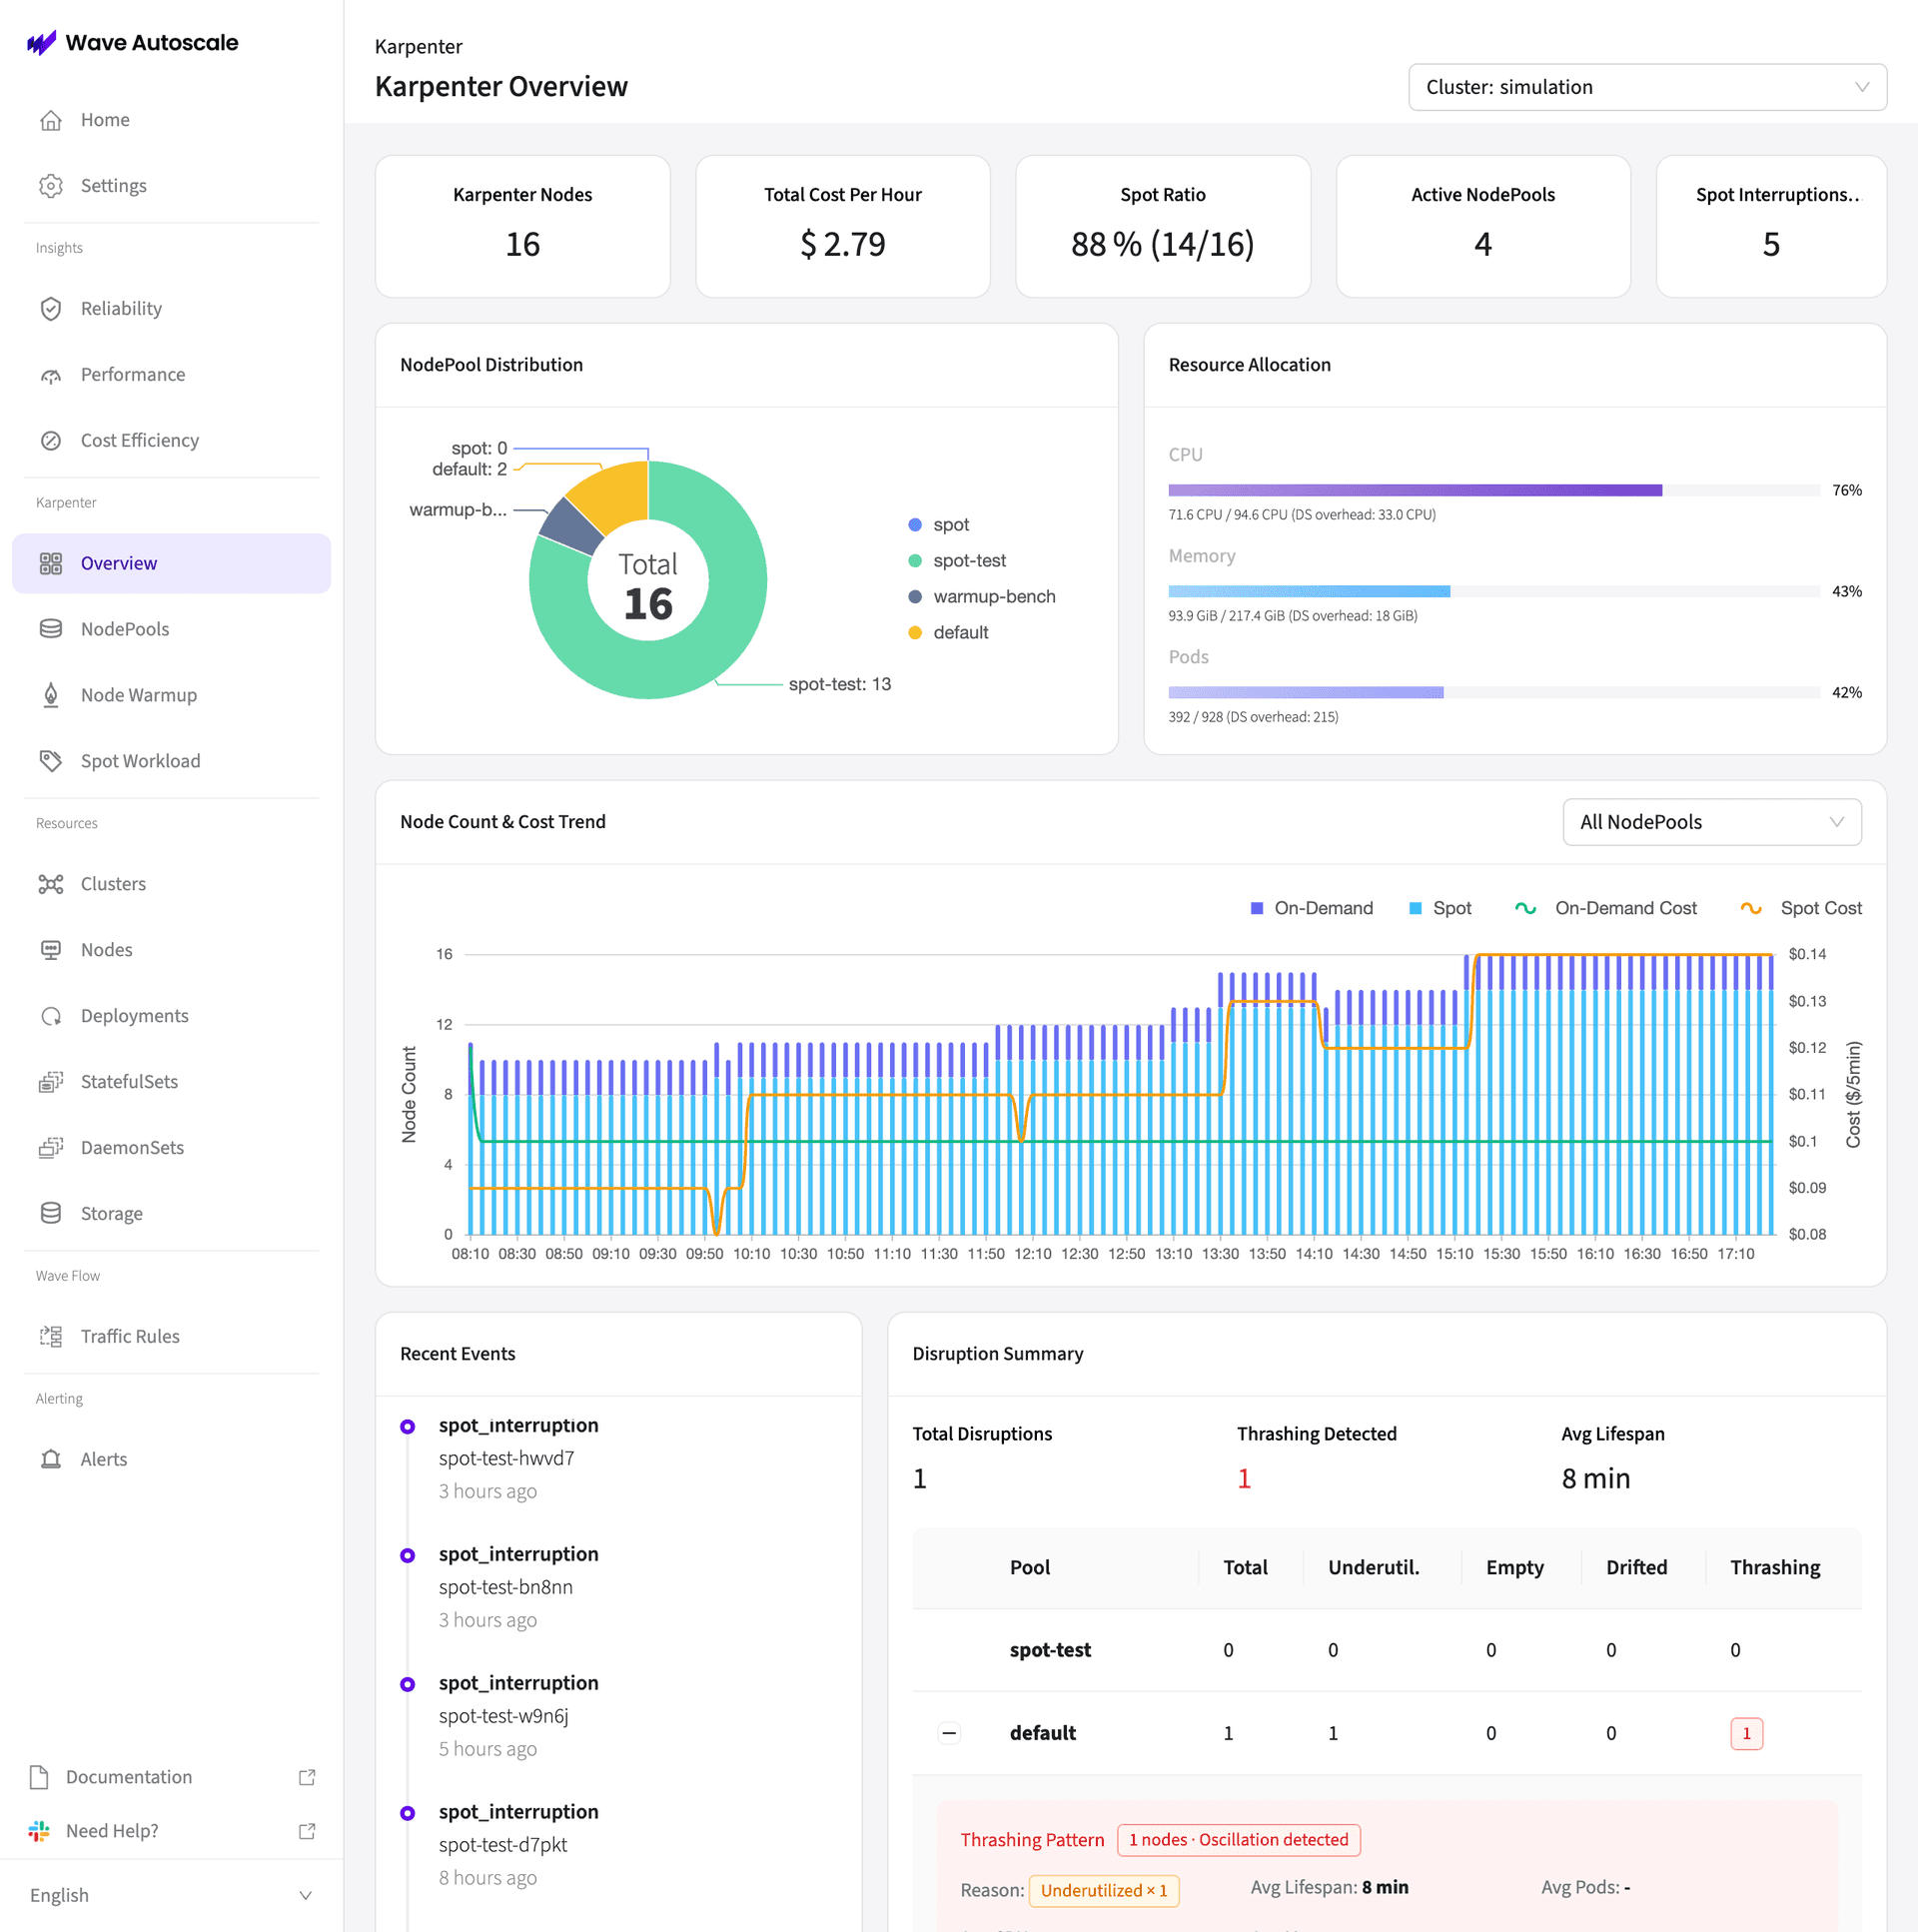
Overview 페이지
Overview 페이지는 다음과 같은 최상위 지표를 한눈에 보여줍니다.
| 지표 | 설명 |
|---|---|
| Karpenter Nodes | Karpenter가 프로비저닝한 활성 노드 총 개수 |
| Total Cost Per Hour | 모든 Karpenter 노드에 대한 예상 시간당 비용 |
| Spot Ratio | Spot 대비 On-Demand 노드 비율 (예: 88% 14/16) |
| Active NodePools | 활성 NodePool 수 |
| Spot Interruptions | 최근 spot interruption 이벤트 수 |
지표 아래에는 다음 항목이 표시됩니다.
- NodePool Distribution: NodePool별 노드 배분을 보여주는 도넛 차트
- Resource Allocation: CPU, Memory, Pod 사용률 바 (오버헤드 가시성 포함)
- Node Count & Cost Trend: On-Demand/Spot 노드 수와 비용 추이를 시간에 따라 추적하는 시계열 차트
- Recent Events: 최근 disruption 및 spot interruption 이벤트
- Disruption Summary: 전체 disruption 수, thrashing 감지 상태, pool별 내역
NodePools
Karpenter > NodePools로 이동하면 모든 NodePool을 테이블 형태로 확인할 수 있습니다.
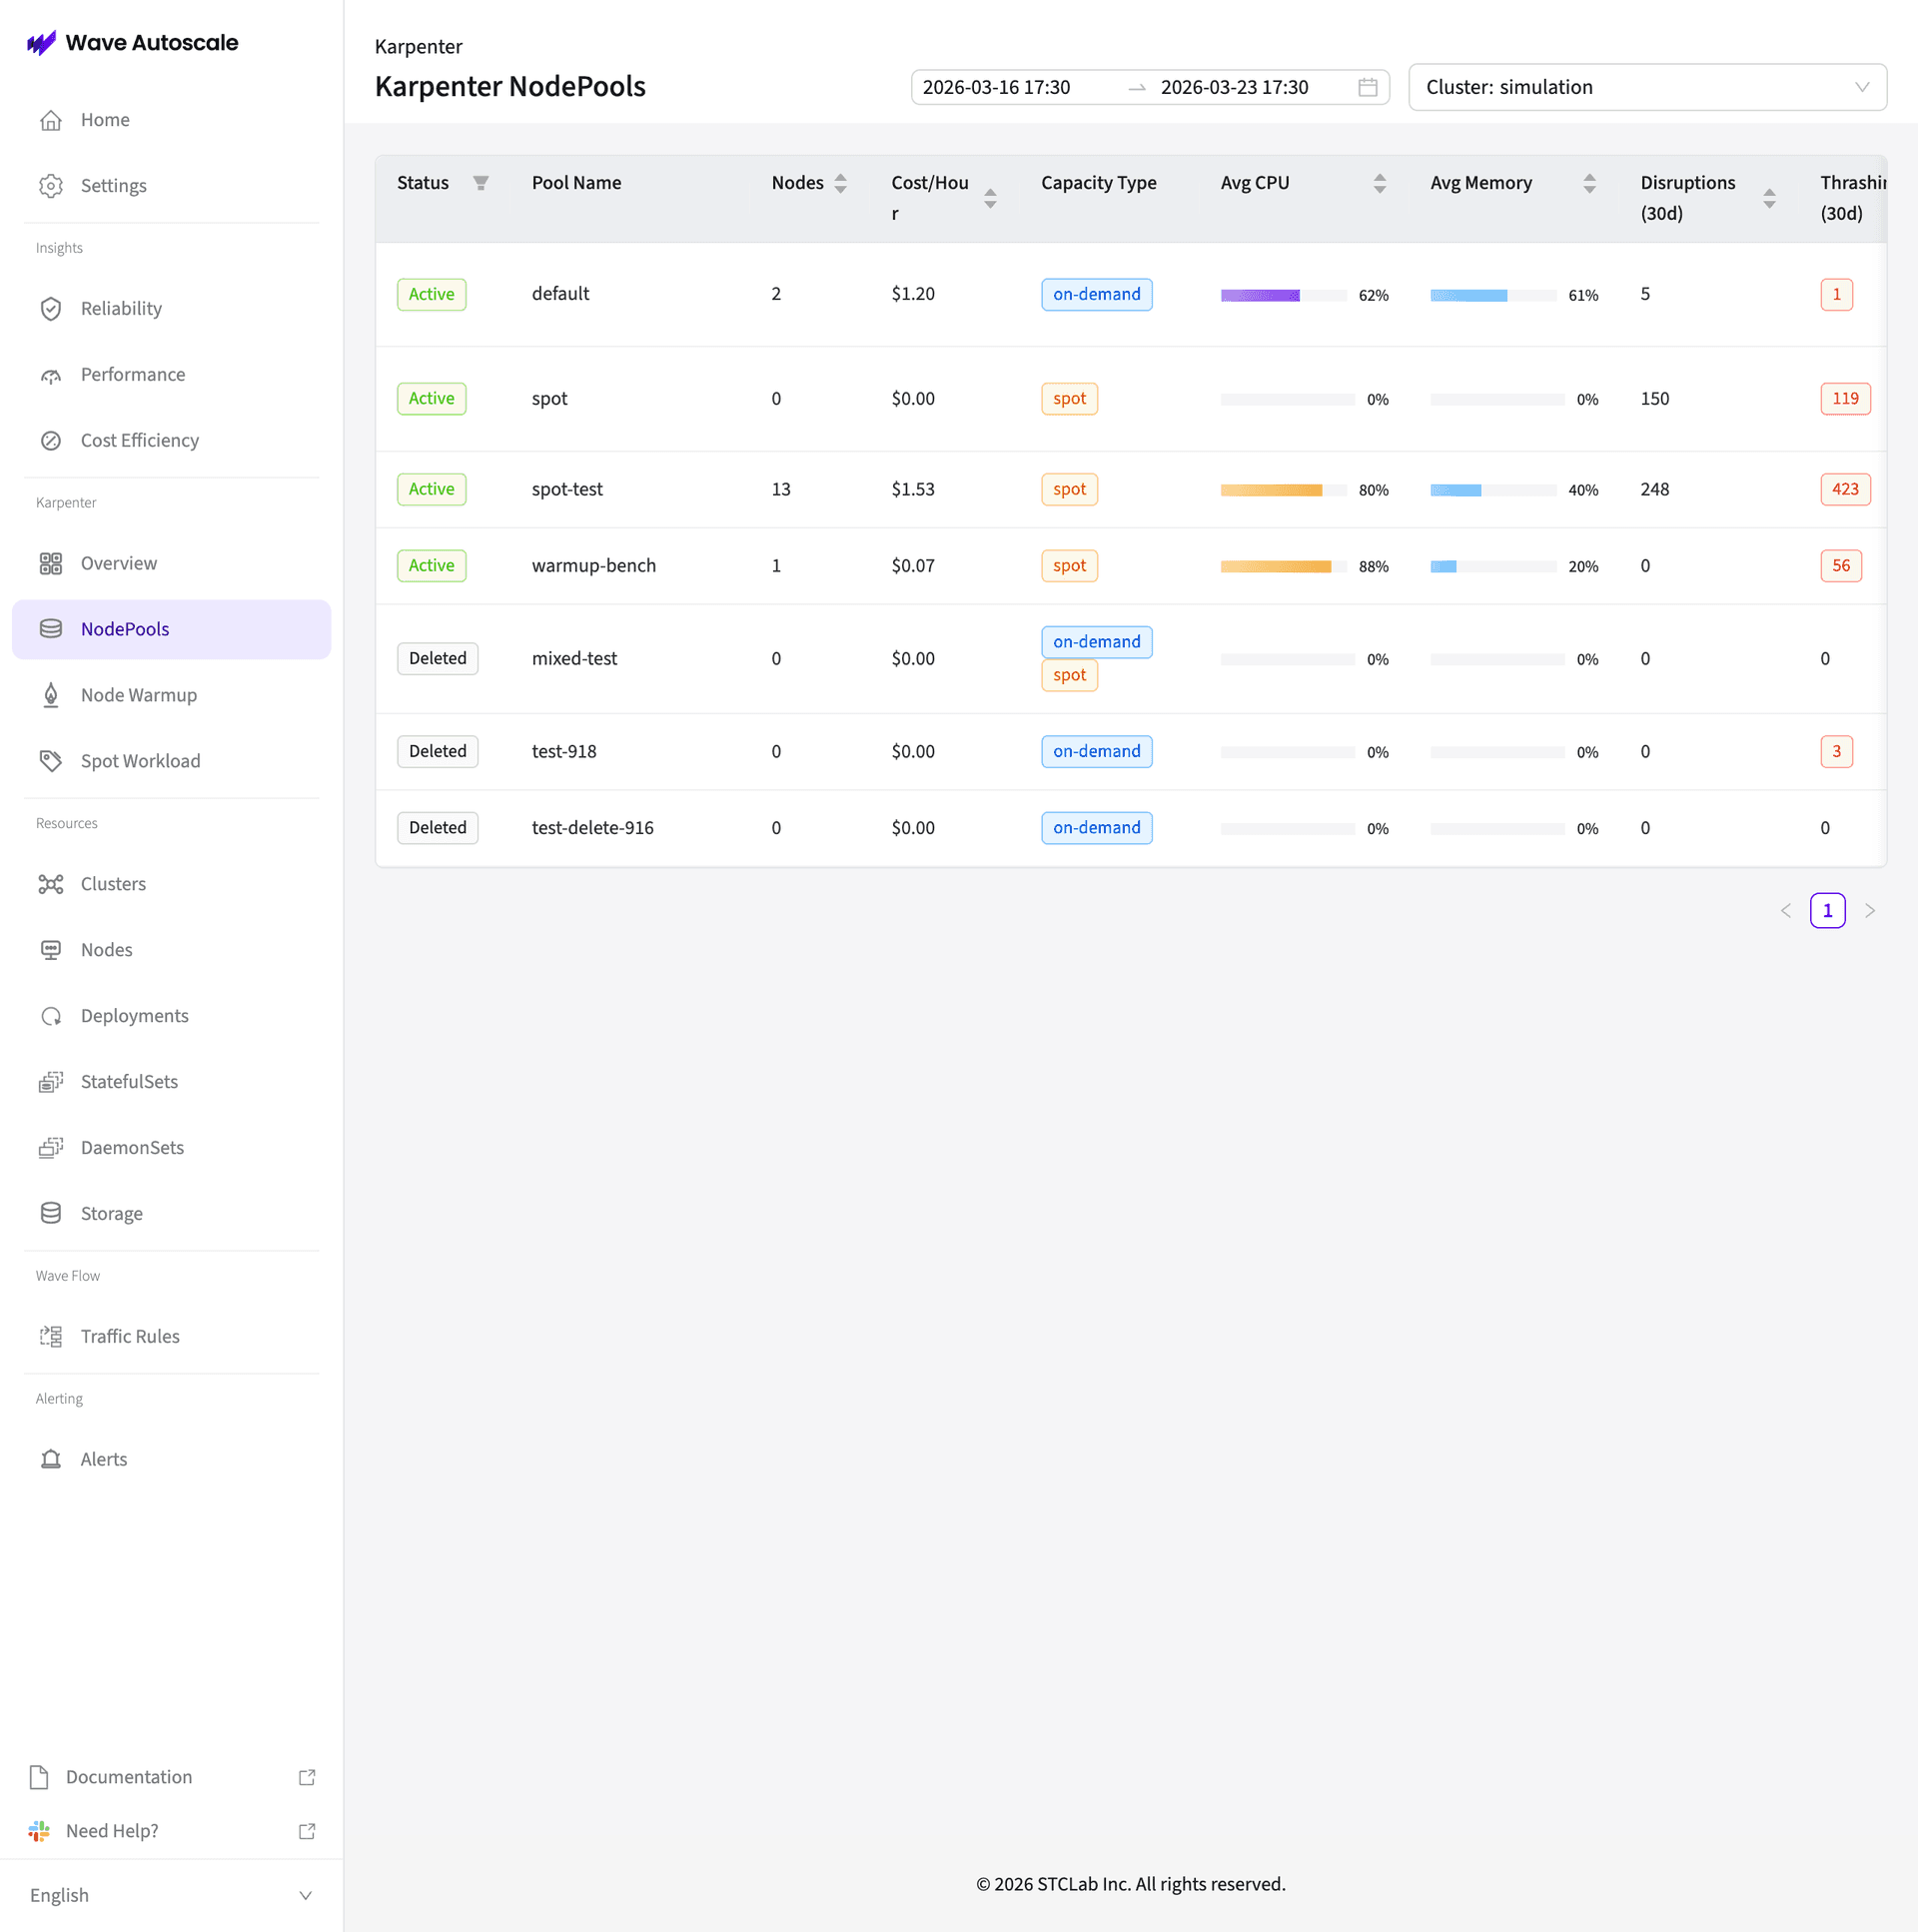
테이블에는 다음이 표시됩니다.
- Status: Active 또는 Deleted
- Pool Name: Karpenter NodePool 이름
- Nodes: 현재 노드 수
- Cost/Hour: 해당 NodePool의 시간당 비용
- Capacity Type: On-Demand, Spot 또는 혼합
- Avg CPU / Avg Memory: 리소스 사용률 바
- Disruptions (30d): 최근 30일간 disruption 수
- Thrashing (30d): thrashing 이벤트 수
NodePool 행을 클릭하면 상세 페이지로 들어갈 수 있습니다.
NodePool 상세 화면 · Info 탭
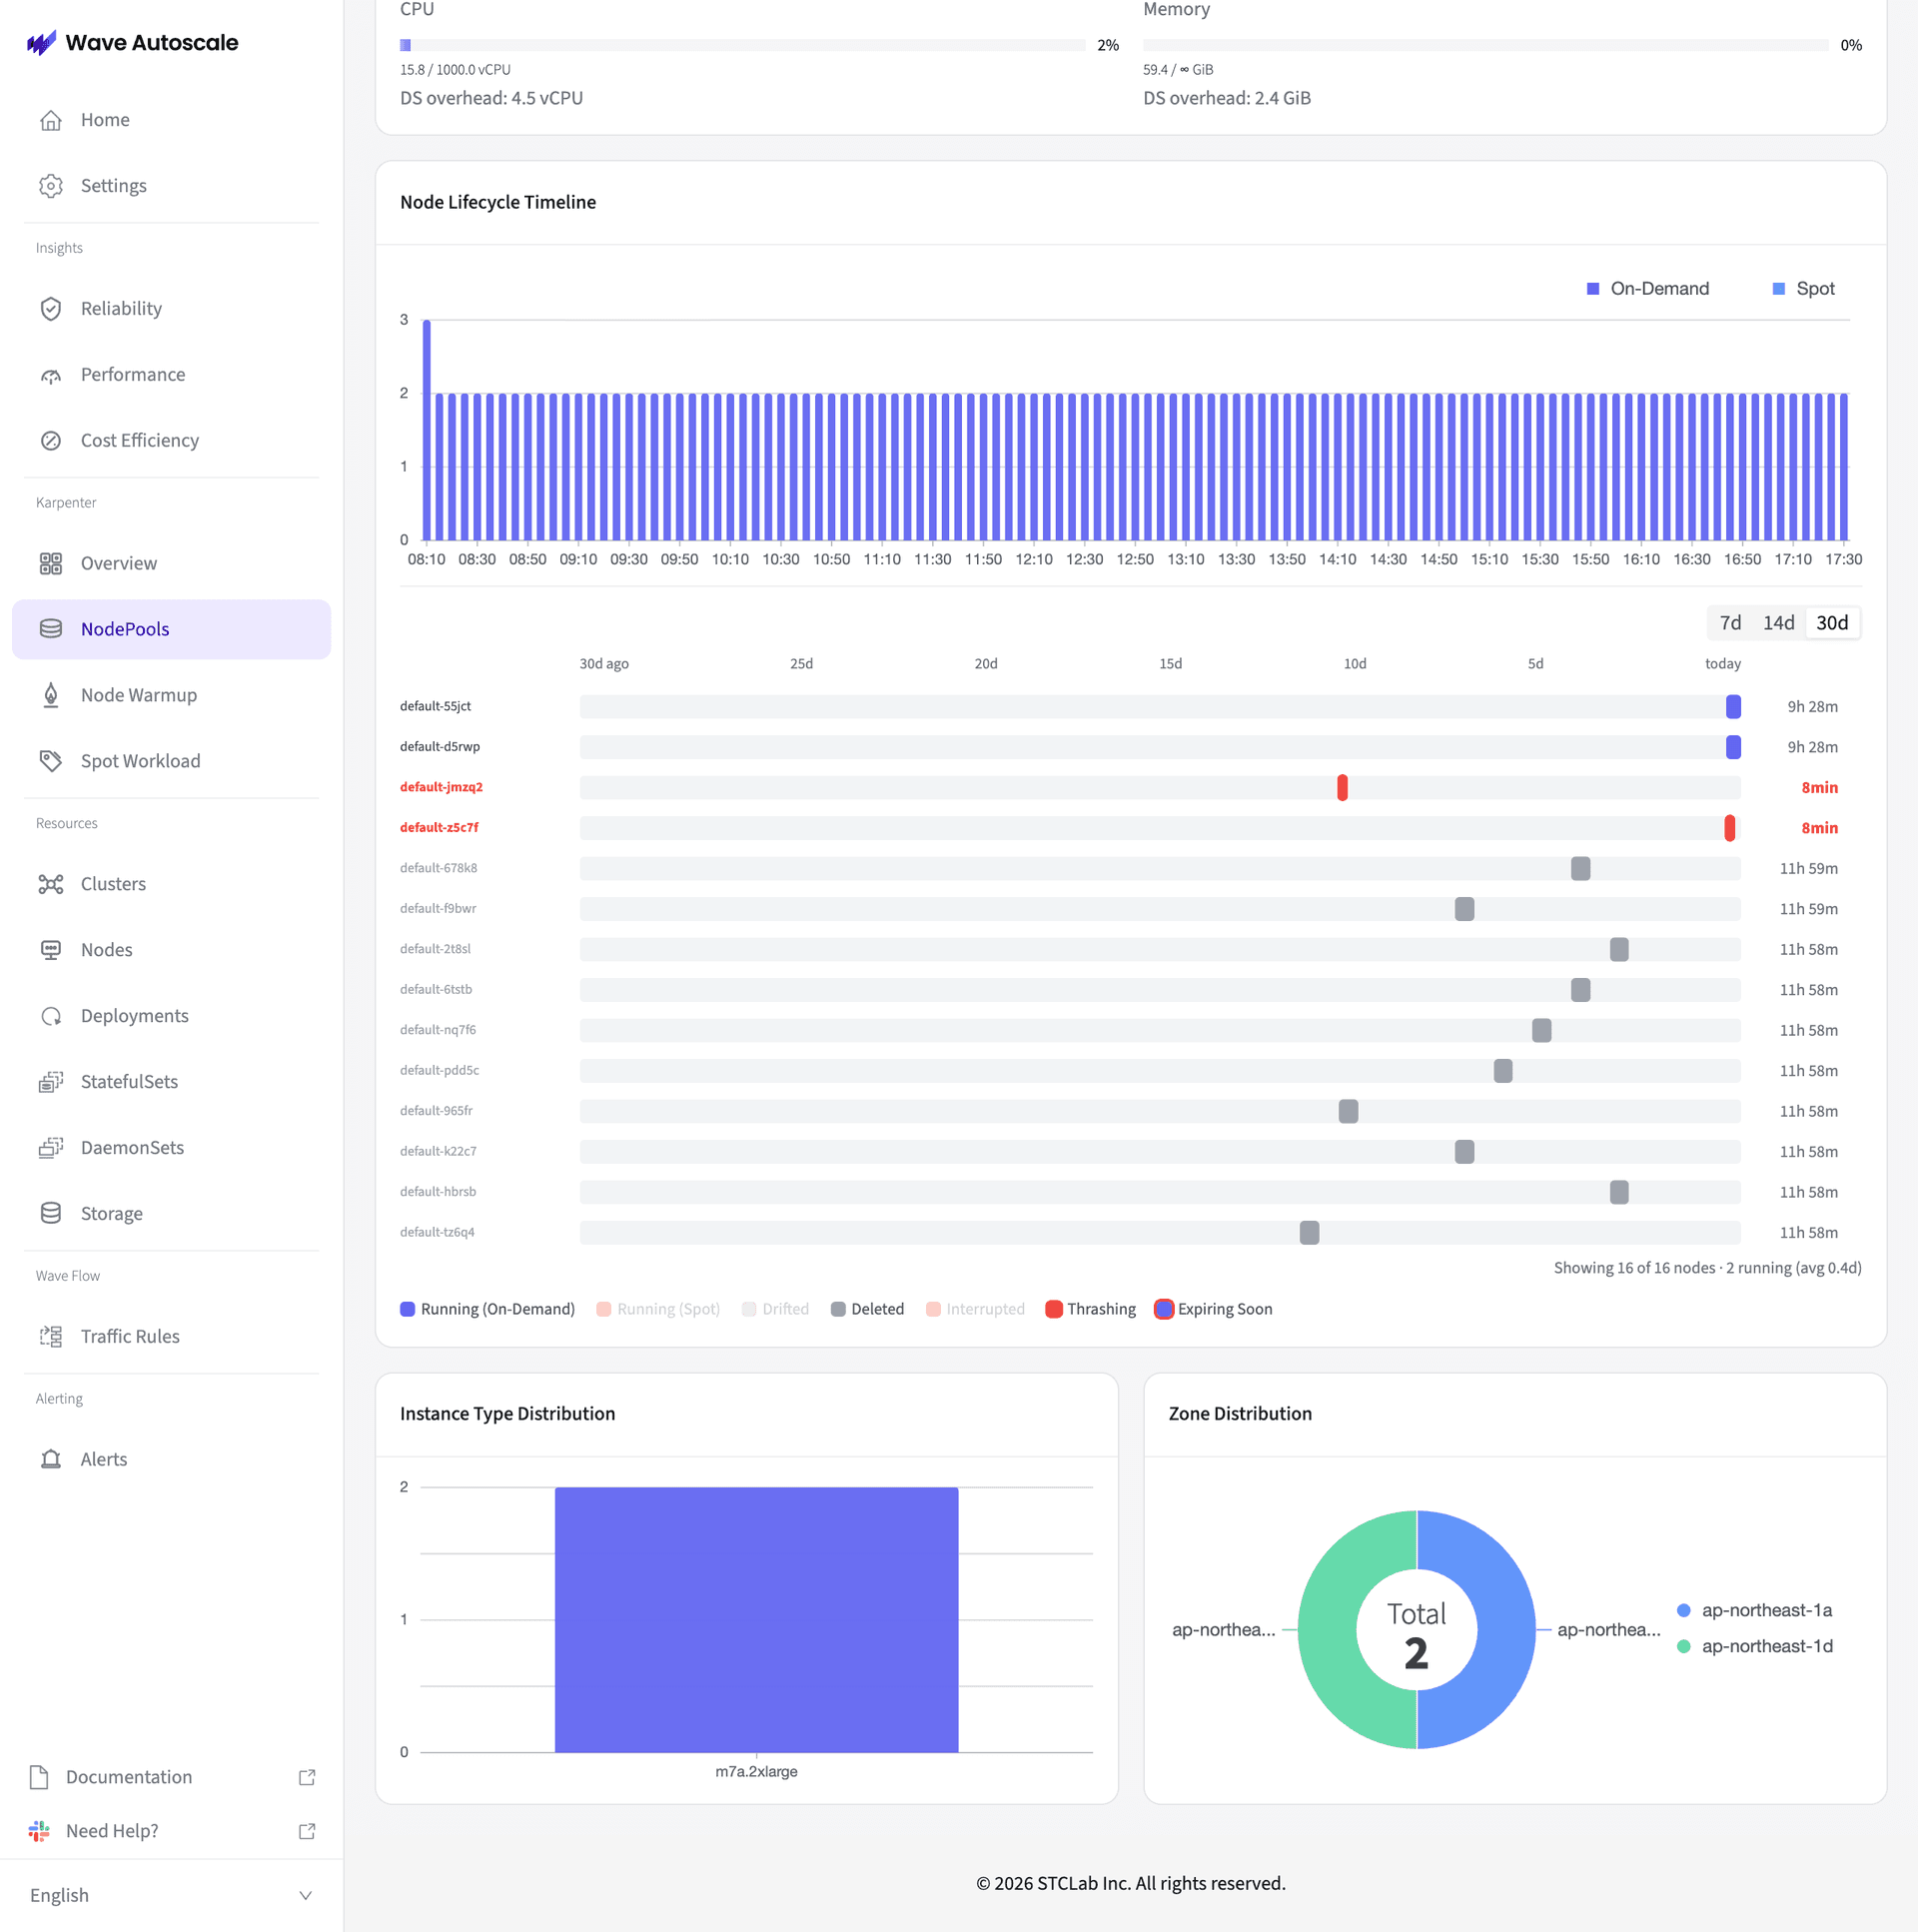
Info 탭에는 다음이 표시됩니다.
- Resource Allocation: OS 오버헤드를 포함한 CPU, Memory 사용률
- Node Lifecycle Timeline: 각 노드의 수명을 보여주는 시각적 타임라인 (On-Demand는 파란색, Spot은 보라색, Deleted는 회색, Thrashing은 빨간색)
- Instance Type Distribution: 사용 중인 인스턴스 타입의 막대 차트
- Zone Distribution: AZ 분포를 보여주는 도넛 차트
NodePool 상세 화면 · NodeClaims 탭
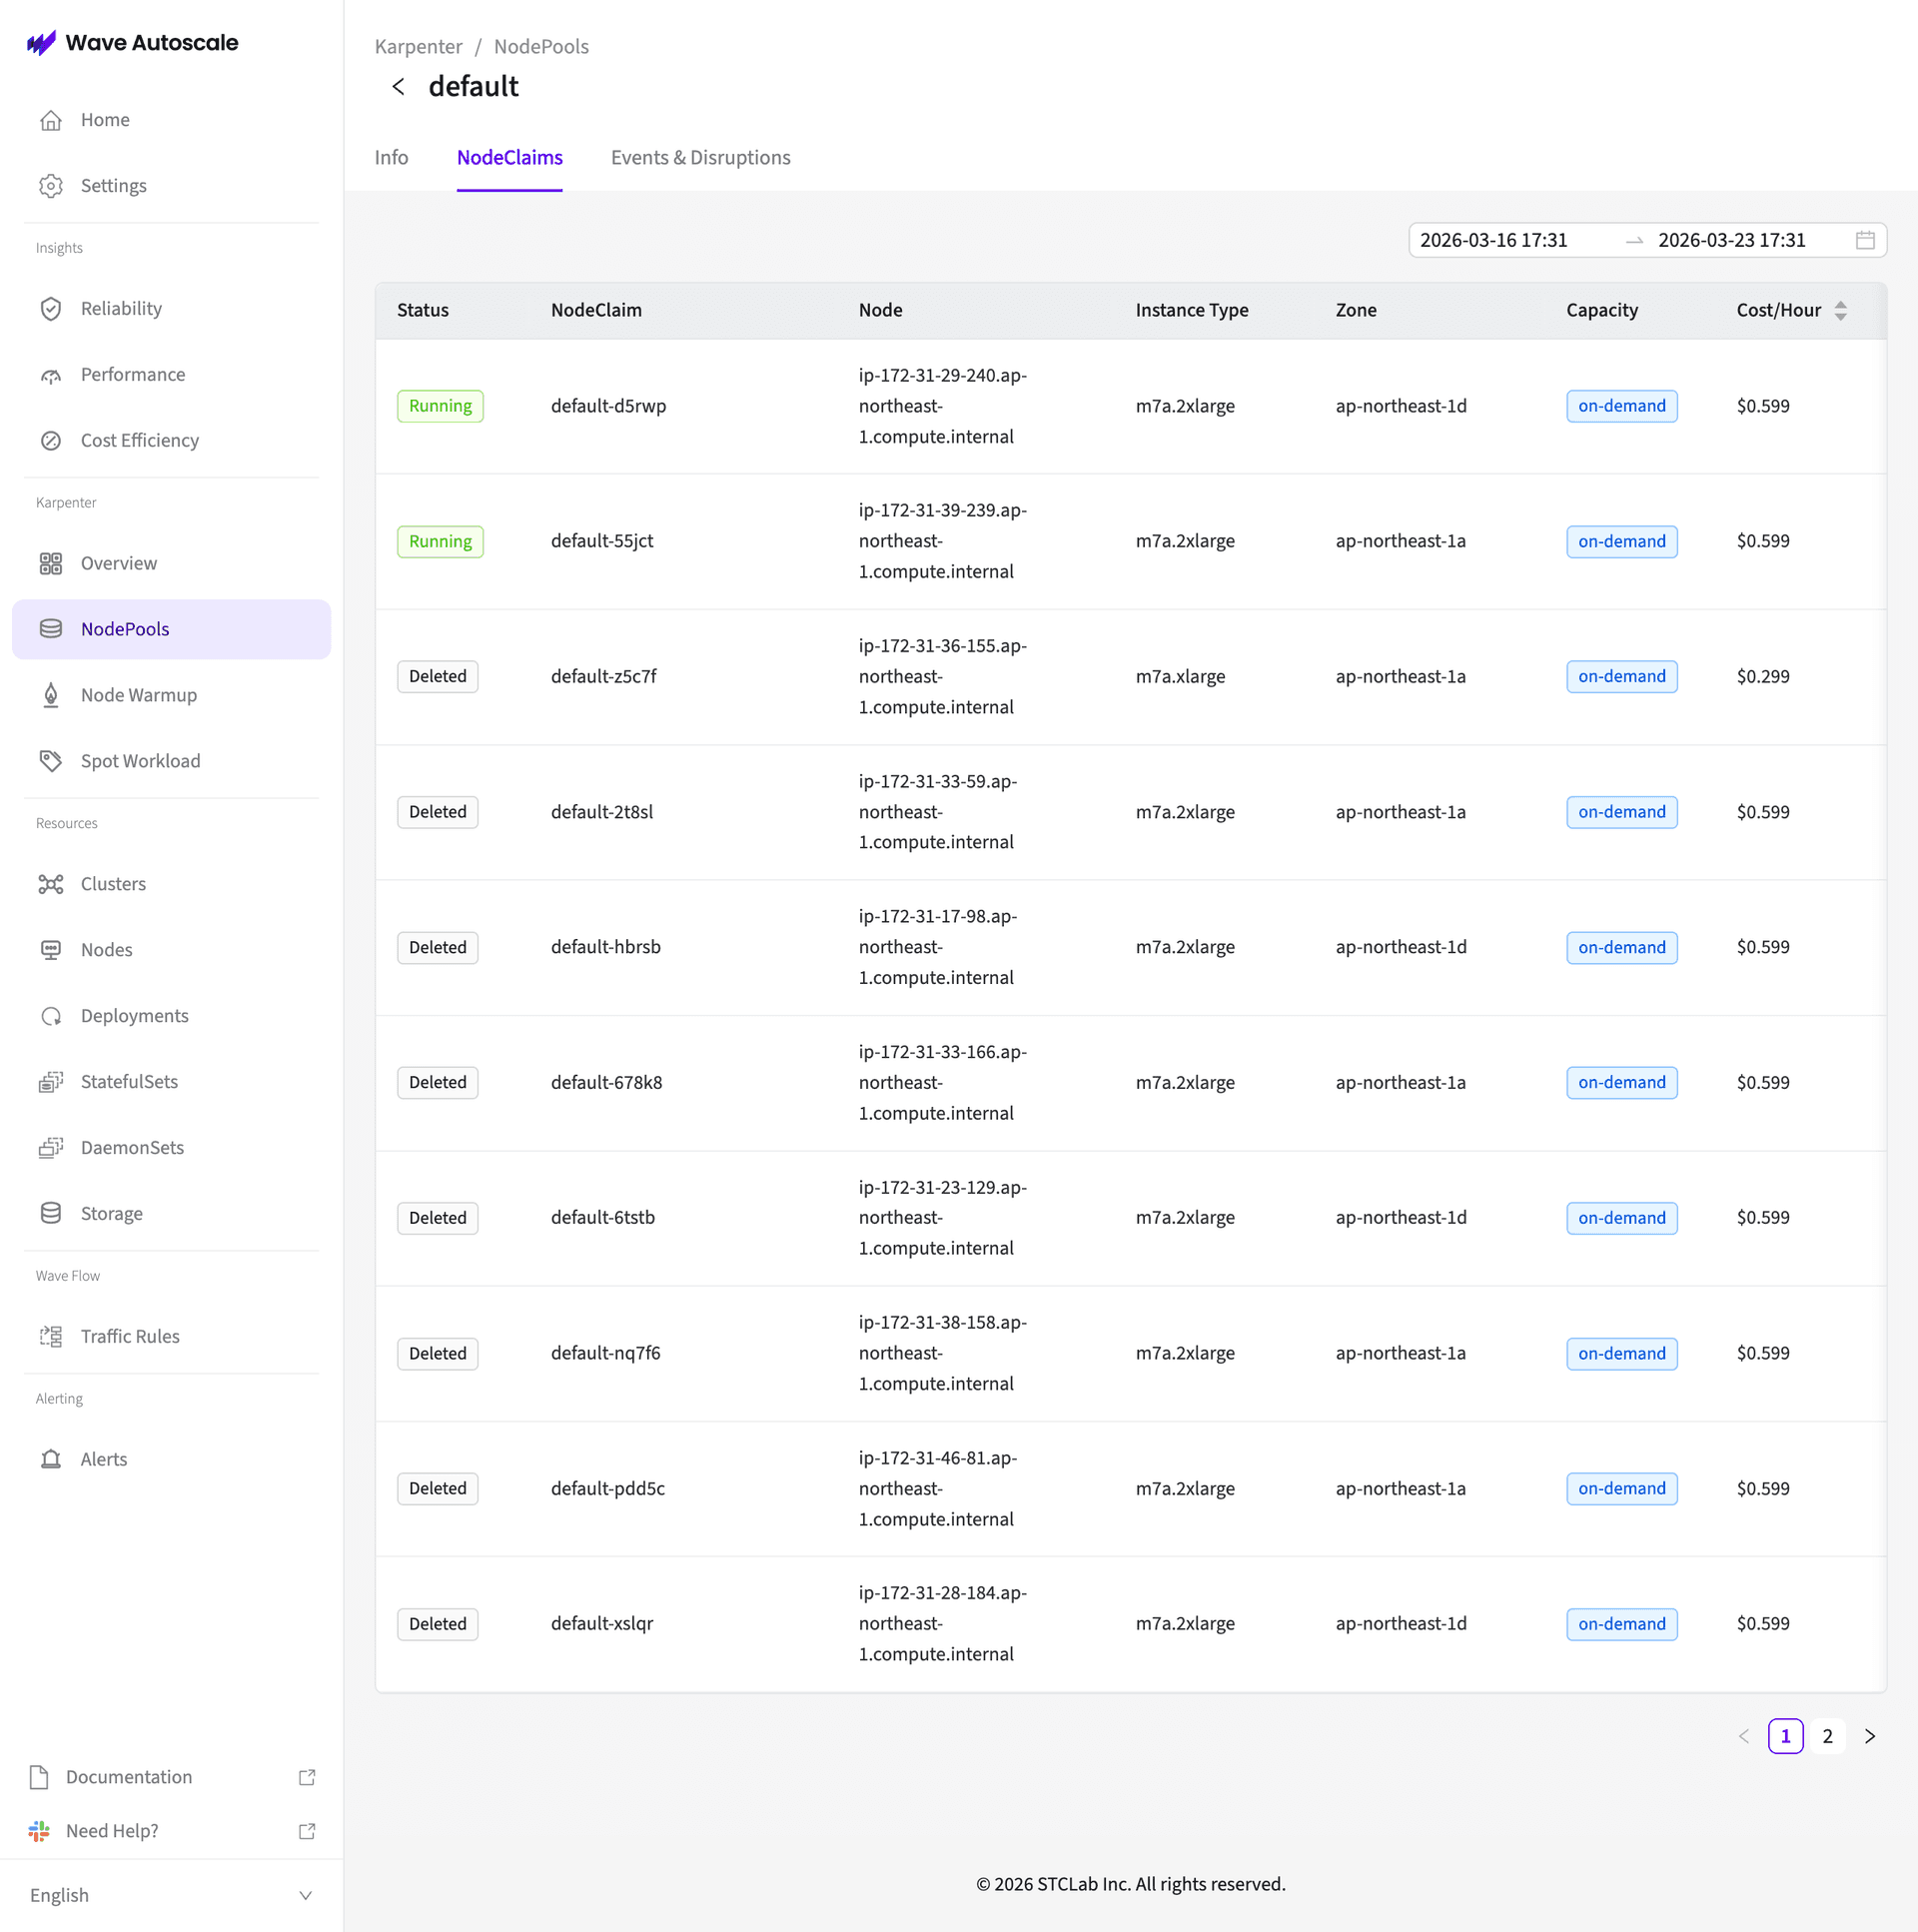
Running 및 Deleted 상태를 포함한 모든 NodeClaim을 다음과 함께 나열합니다.
- Status: Running 또는 Deleted
- NodeClaim: Karpenter NodeClaim 이름
- Node: Kubernetes 노드 이름과 IP
- Instance Type: EC2 인스턴스 타입
- Zone: 가용 영역(availability zone)
- Capacity: On-Demand 또는 Spot
- Cost/Hour: 노드별 비용
NodeClaim 행을 클릭하면 상세 사이드바가 열립니다.
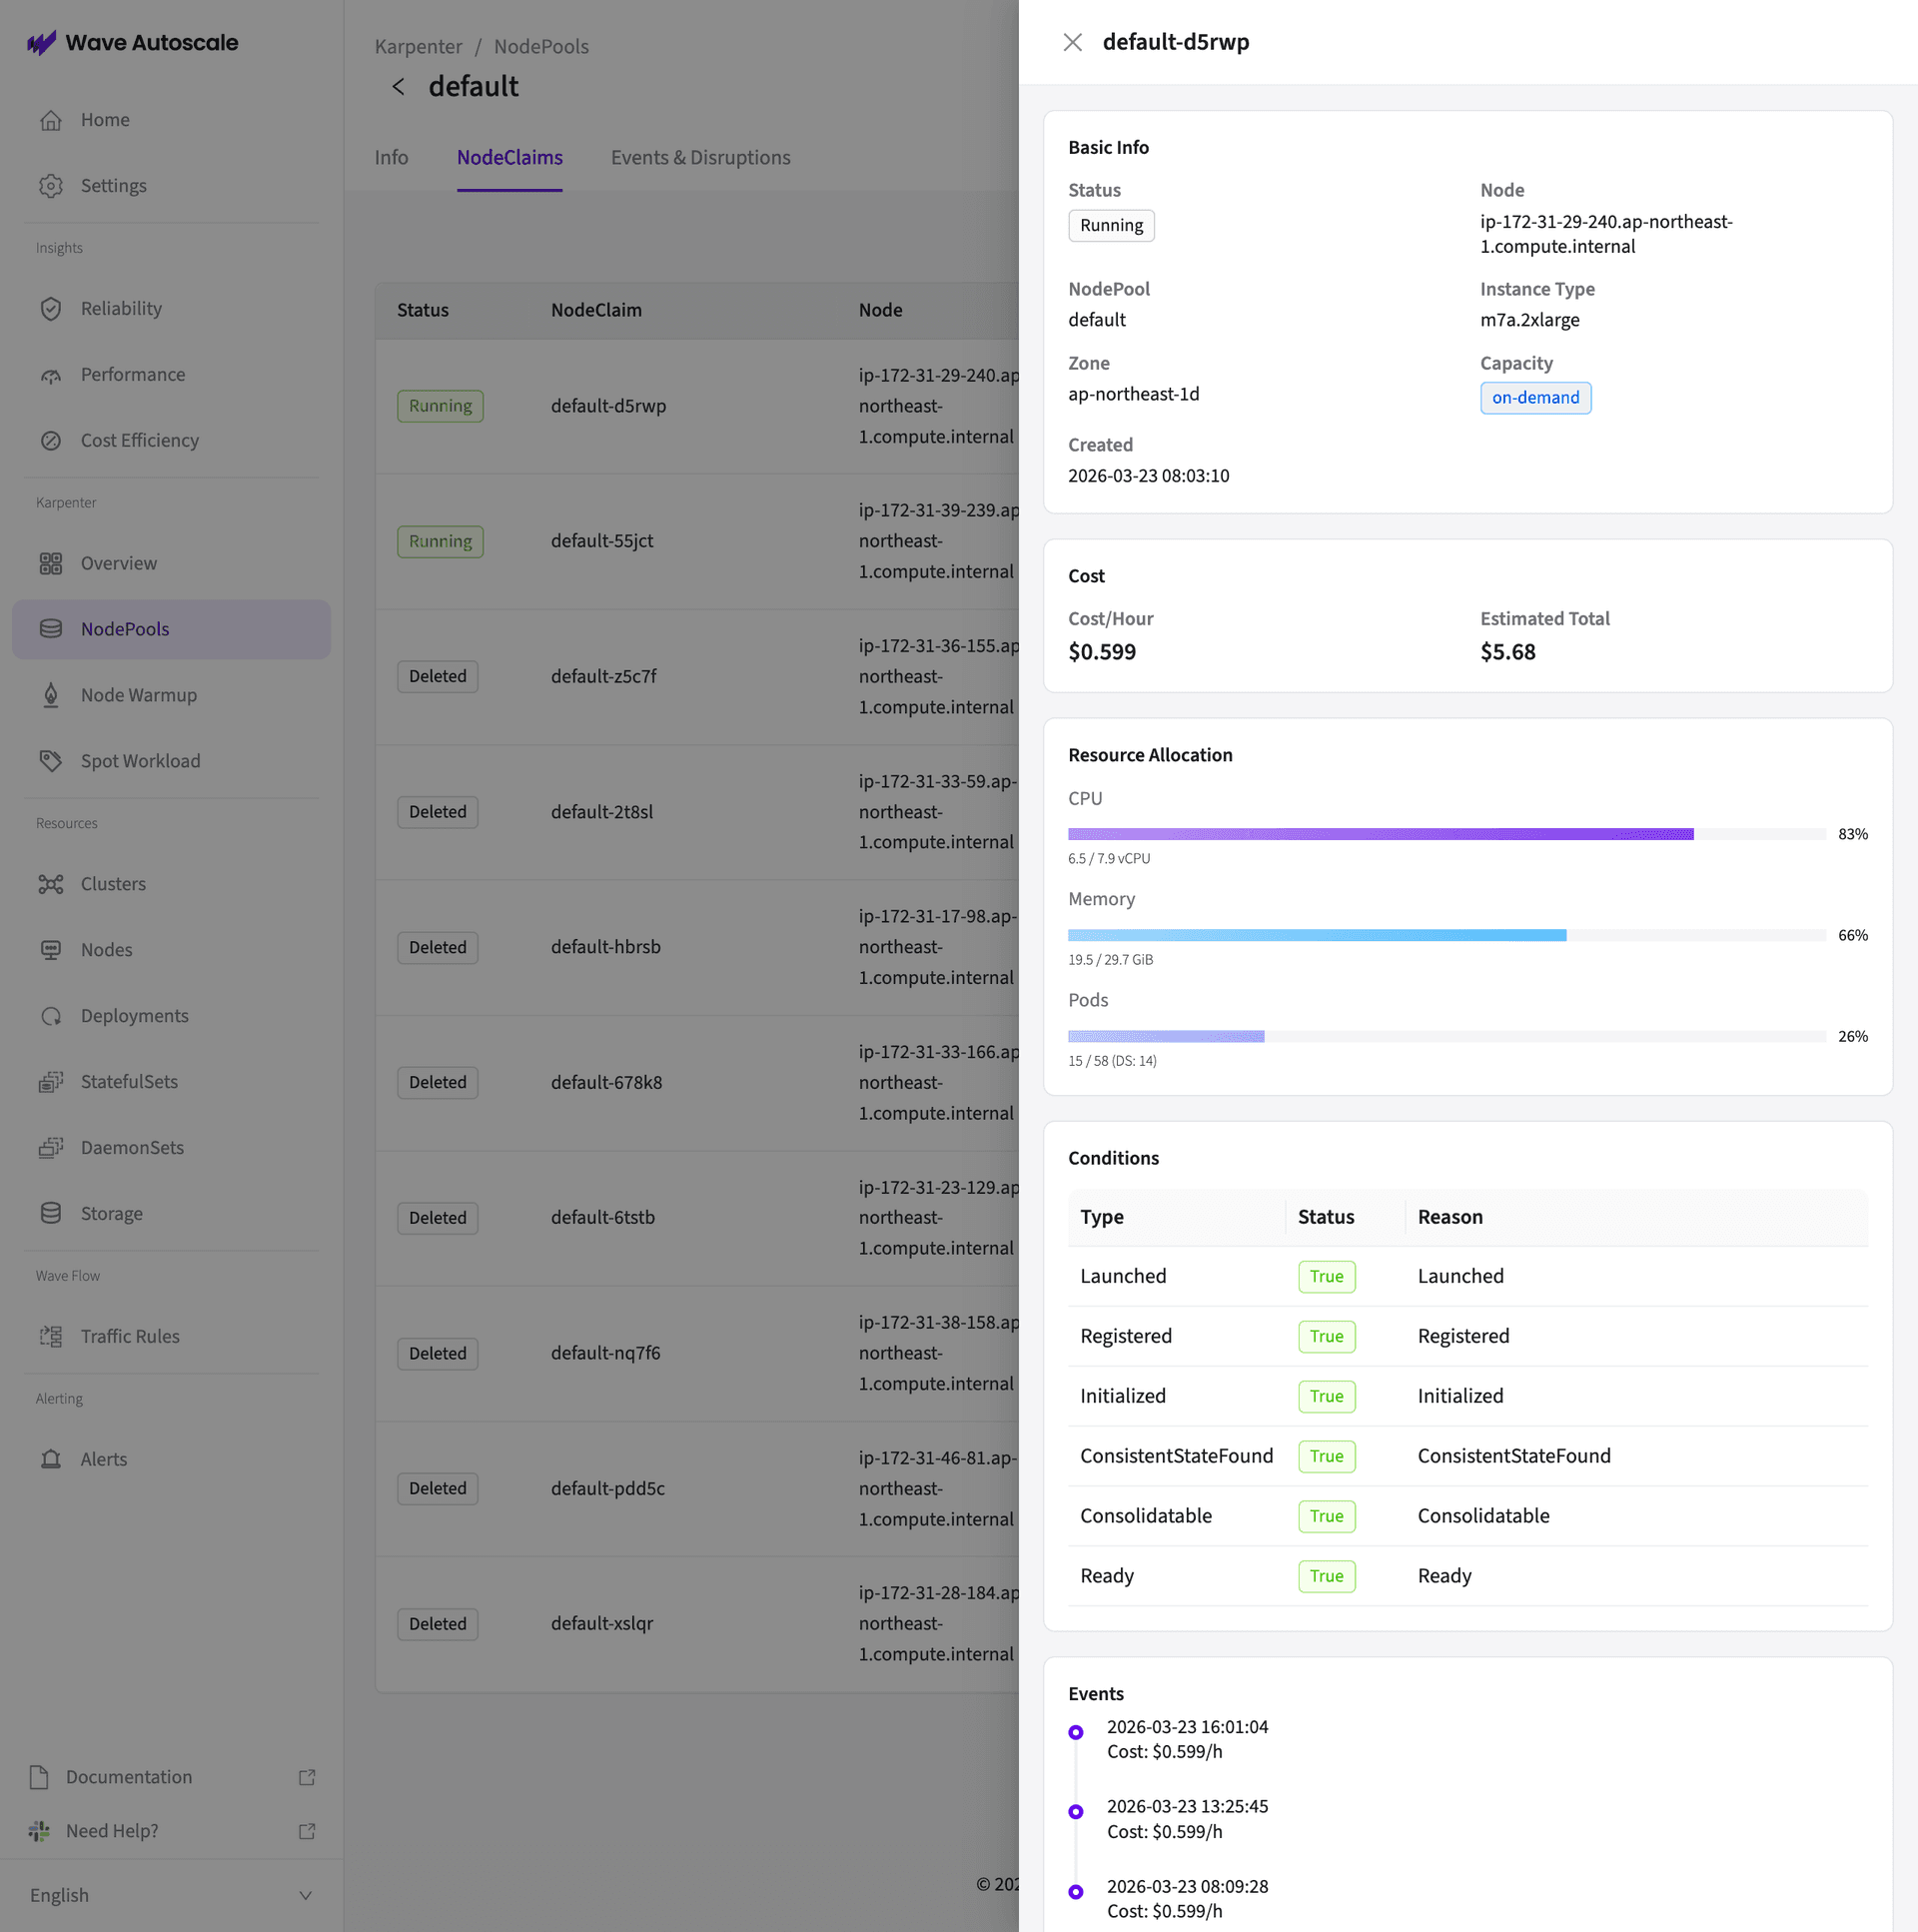
사이드바에는 다음이 표시됩니다.
- Basic Info: Status, Node, NodePool, Instance Type, Zone, Capacity, 생성 시각
- Cost: Cost/Hour 및 예상 총 비용(Estimated Total)
- Resource Allocation: CPU, Memory, Pods 사용률 바
- Conditions: Launched, Registered, Initialized, ConsistentStateFound, Consolidatable, Ready 상태
- Events: 타임스탬프가 포함된 비용 이력 이벤트
NodePool 상세 화면 · Events & Disruptions 탭
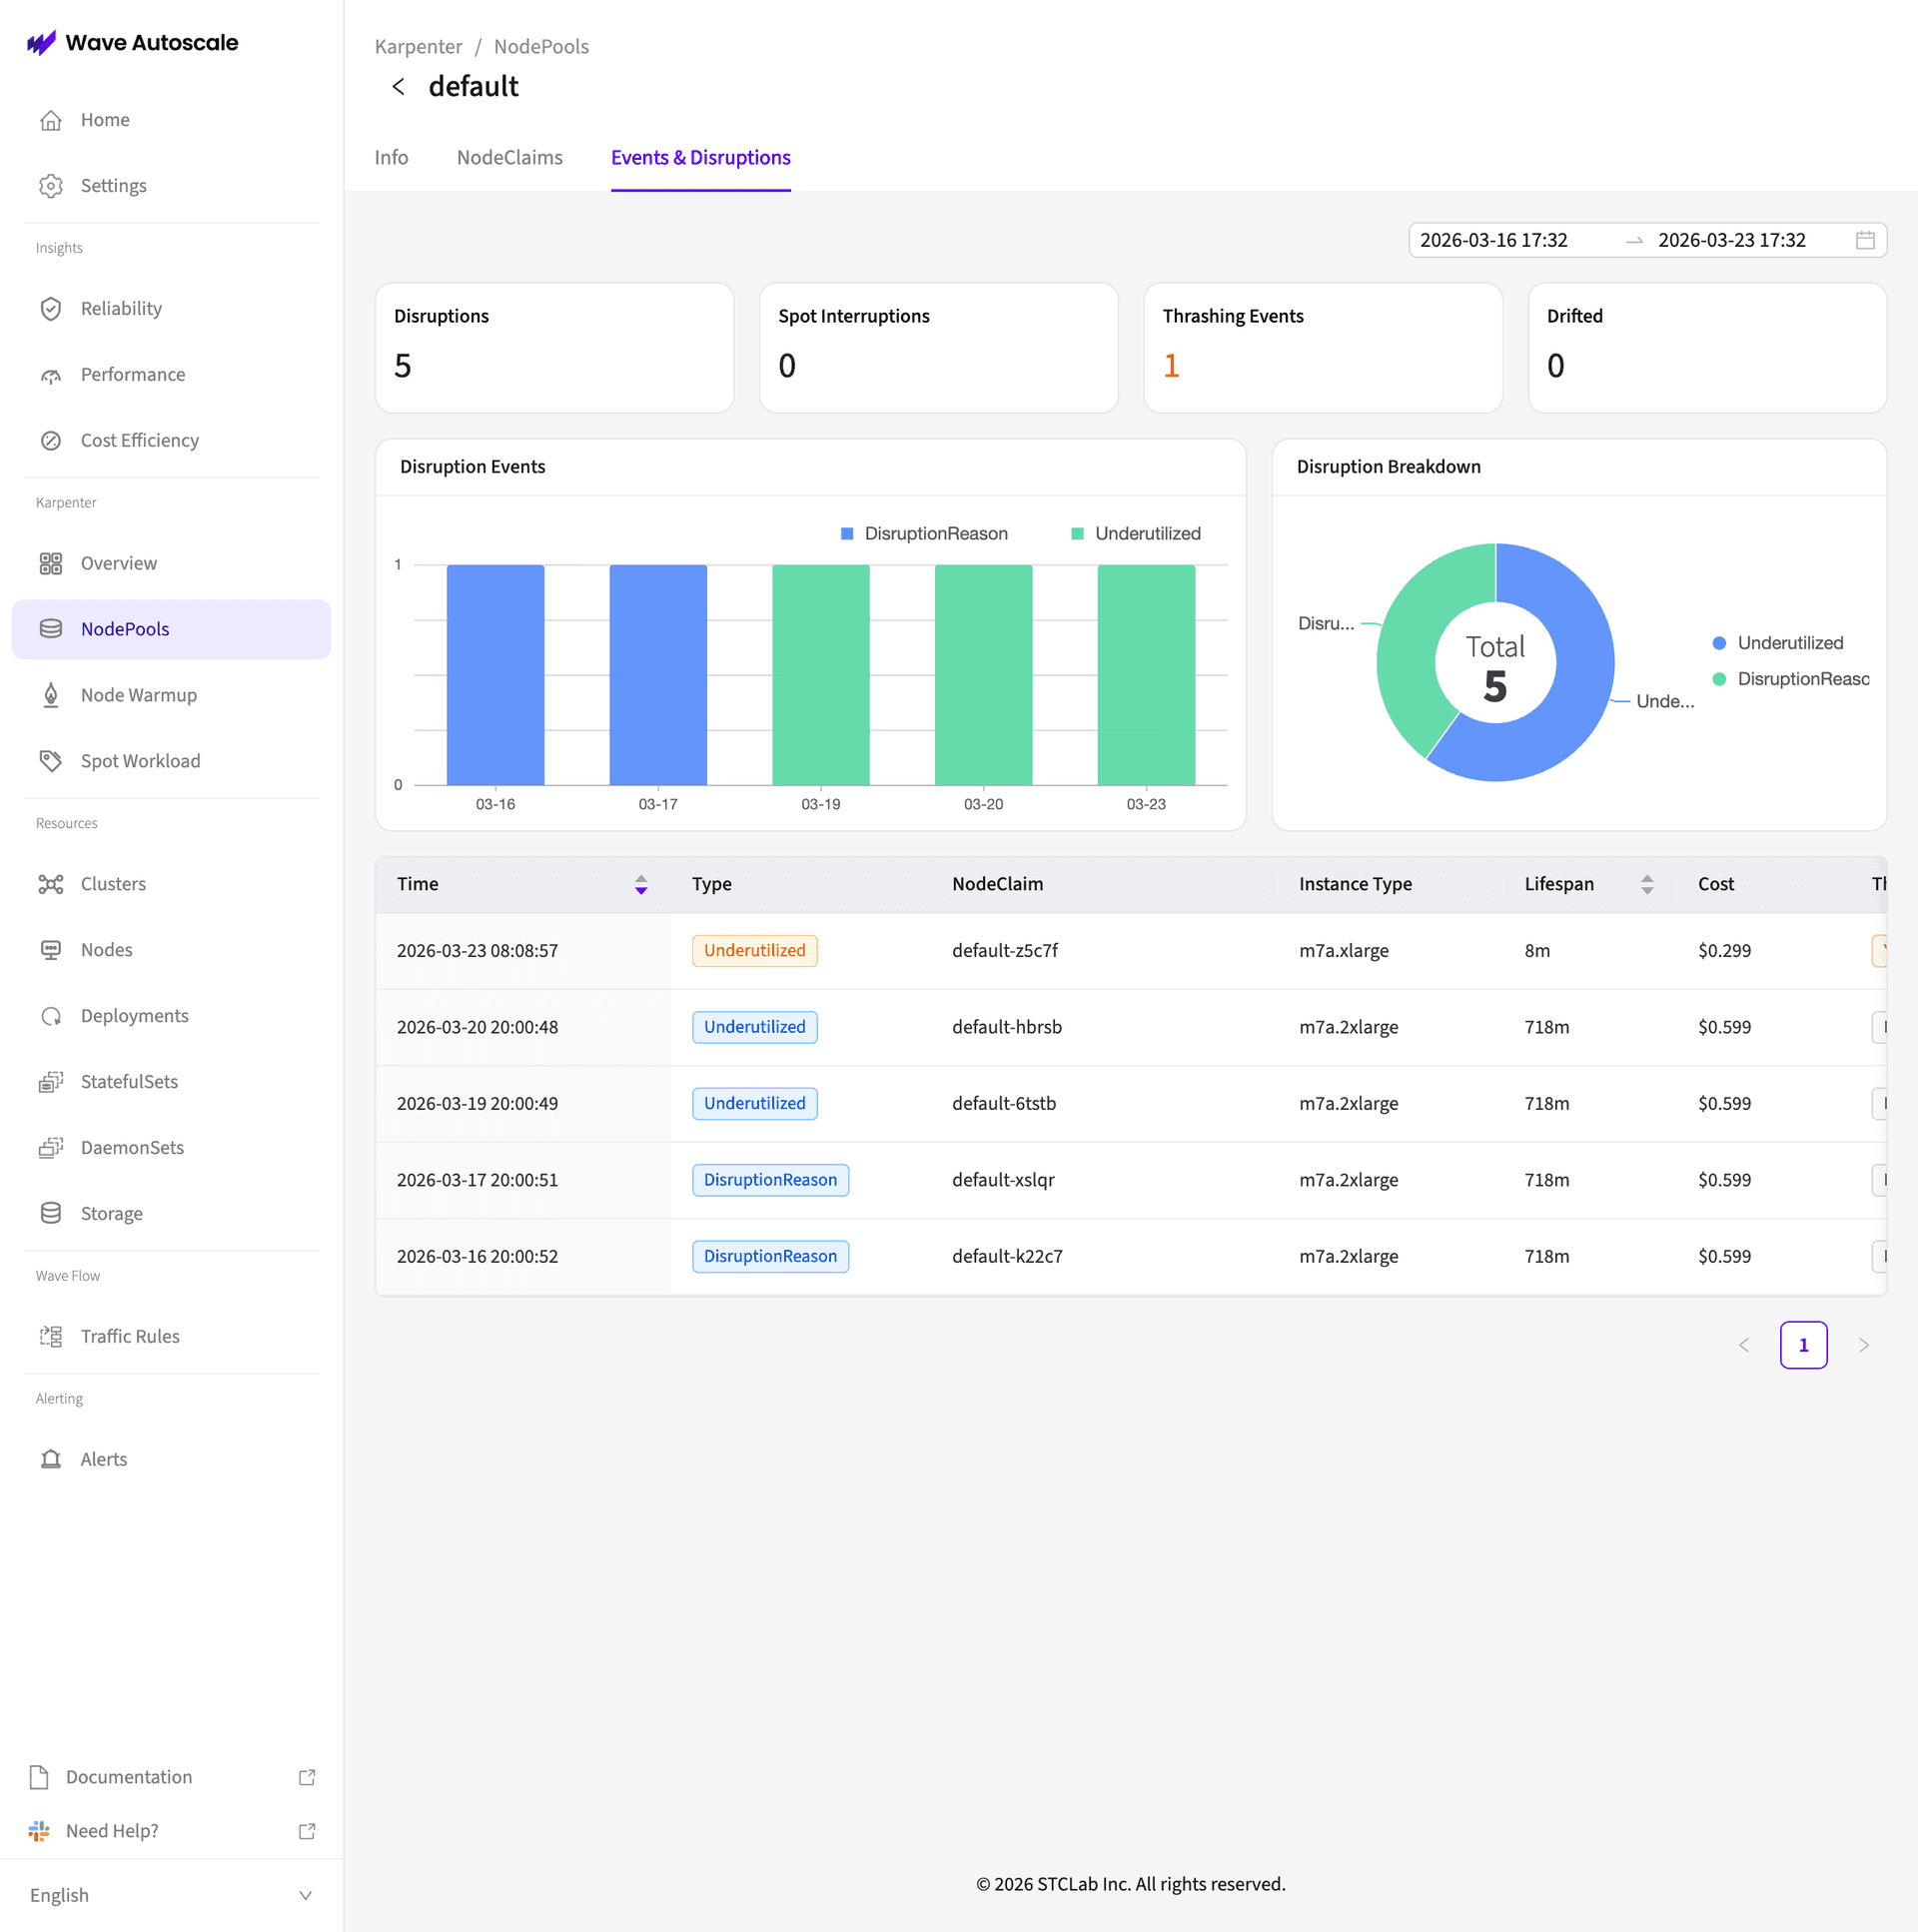
해당 NodePool의 모든 disruption 활동을 추적합니다.
- Summary metrics: Disruptions, Spot Interruptions, Thrashing Events, Drifted 건수
- Disruption Events: 시간에 따른 막대 차트
- Disruption Breakdown: 유형별 도넛 차트 (Underutilized, DisruptionReason)
- Events table: Time, Type, NodeClaim, Instance Type, Lifespan, Cost
Thrashing 감지
대시보드는 node thrashing(노드가 빠르게 반복적으로 생성되고 삭제되는 현상)을 자동으로 감지합니다. 감지되면 Overview 페이지에 다음 정보를 포함한 Thrashing Pattern 알림이 표시됩니다.
- 영향받은 노드 수
- 원인 (예: "Oscillation detected")
- thrashing이 발생한 노드의 평균 수명
- 영향받은 평균 pod 수
| 원인 | 설명 |
|---|---|
| Tight Constraints | NodePool 요구 조건이 너무 제한적이어서 노드가 프로비저닝된 직후 바로 consolidation됨 |
| Conflicting Policies | 여러 NodePool 또는 스케줄링 규칙이 충돌해 프로비저닝/제거가 반복됨 |
| Scheduling Conflicts | Pod affinity/anti-affinity 또는 topology spread constraint로 인해 안정적인 배치가 불가능함 |
관련 문서
- Getting Started: Karpenter 통합 설치 및 구성
- Node Warmup: pod 시작 지연을 줄이는 노드 사전 프로비저닝
- Spot Workload Placement: 비용 최적화를 위한 spot/on-demand 자동 분할